
This page shows statistics measured by our external monitoring provider, Pingdom.
-
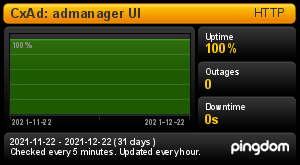
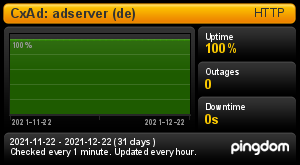
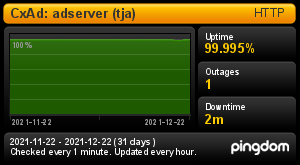
Up time - This is the proportion of time that checks from our monitoring service return OK. An up time of 99.99% means the service was unavailable for ~4.5 minutes over the course of the month. We route traffic to other data centres in the event of an outage. The charts below reflect individual data centre status, not that of the service as a whole.
-
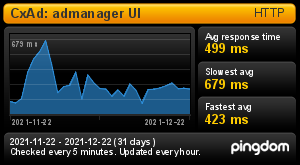
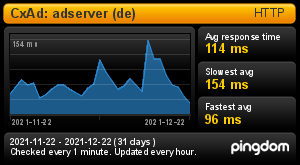
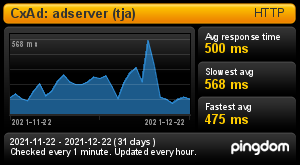
Response time - This measures the response time as seen from end-user browsers located around the world. Note that the monitoring service does not always check the data centre closest to it, so it is possible that checks from infrastructure in California may be performed against hosts in Europe. Response times between 120ms and 600ms are normal.
|
|
AdManager |
Ad Servers (Europe) |
Ad Servers (North America) |
Ad Servers (Japan) |
|---|---|---|---|---|
|
Uptime |
|
|
|
|
|
Response time
|
|
|
|
|