
An extremely powerful platform, Insight combines all the capabilities of an industry-standard data analytic tool and unparalleled awareness of your content that you get as a publisher. We monitor the standard metrics of an individual page like how many users browsed it within a time period and how long they stayed there. But what is more, we have already crawled it and now understand it in terms of linguistic analysis which considers things like people, places and companies referred to in that article. On this solid basis, you can configure Insight's extended additional filtration capabilities to see both stored information and a real-time data stream from millions of users around the web. Want a deeper view into data related to a specific team, region or author? Combine widgets in workspaces to see everything you need at one glance.
Basic settings
-
As a client, click the product dropdown (1 0n the screenshot below) and select insight.
-
Select the site group / site you want to explore using dropdown (2).
-
Use the next right dropdown (3) to, optionally, apply advanced audience selection with segment filter (read more here).
The detail below refers to the specified site / site group (2), specified time range (4), and, optionally, specified segment (3). The only exclusion is workspace configurations: they may override these basic settings.

Managing filters
Industry-standard metadata parameters, custom categories and site-content filters are stackable in Insight making it a powerful instrument providing widgets with the most specific information you need.
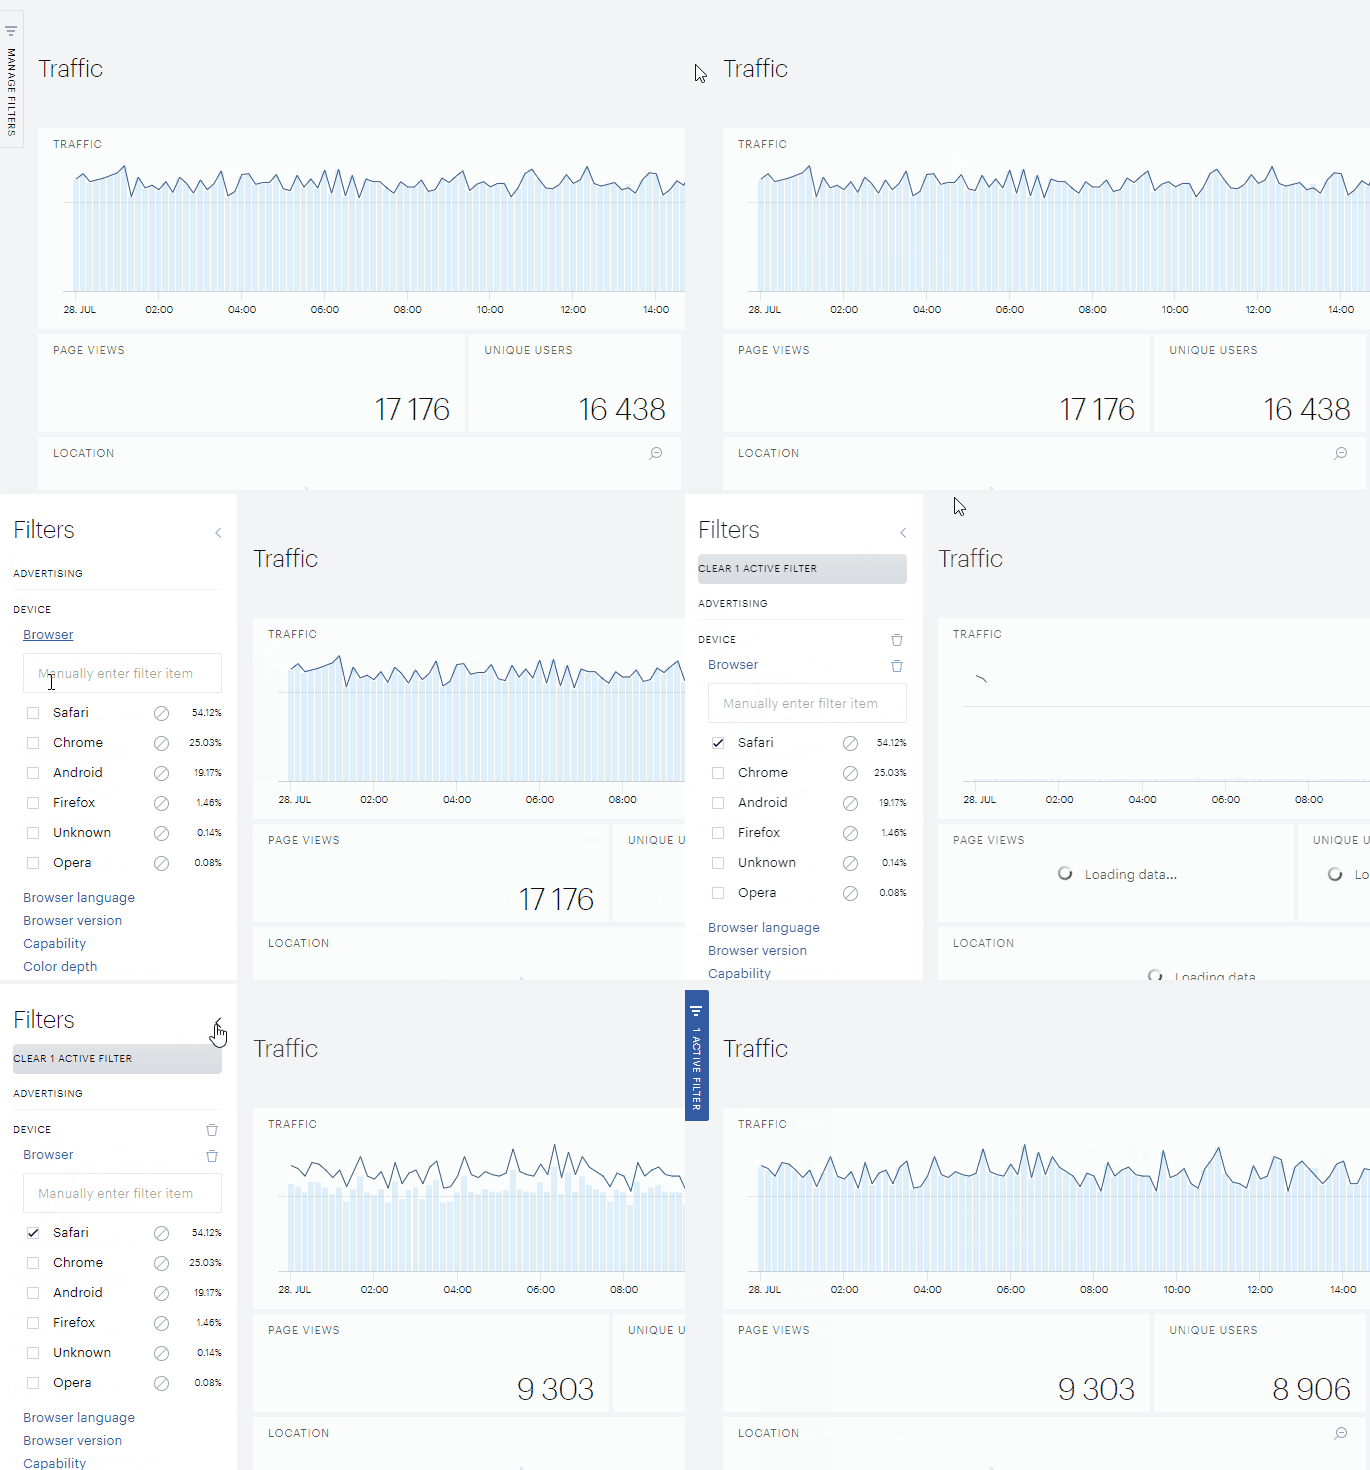
Click the button on the left to open the filter pane and define the group of the pages you want to analyse. With Insight, you can combine industry-standard filters (device, location etc.) with your custom user-prefixed filters (xyz-categories/healthcare) and filters based on site content (company, entity etc.). Against each filter you see how many pages (in %) it covers. You can also exclude all pages having a certain parameter by clicking a cancel icon against the title name.
You can unselect a filter by clicking a trash bin icon against it or unselet all with the “Clear X filters” button on the top of the filter list. The Manually enter filter item field is handy when you want to find a specific filter but it’s not among the most popular filters. If you're enterig a filter value which is not in the top 100 results, auto completion won't work, but you still can enter and apply it. If the percentage is lower than 0.01%, it will be displayed as "0.00%"; if your item is new, not found over your time period, it will be added as a filter with "??%". Thus, you can enter anything you like: if it's there, it will show. if it is very popular, it will auto complete too.
With no filter selected, only limitations of the Basic settings are applied to the traffic.
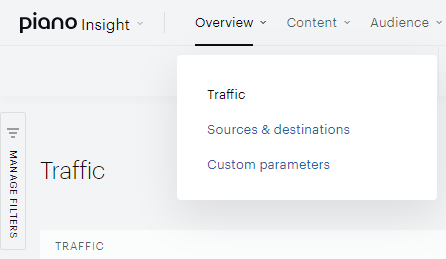
Overview button
Traffic
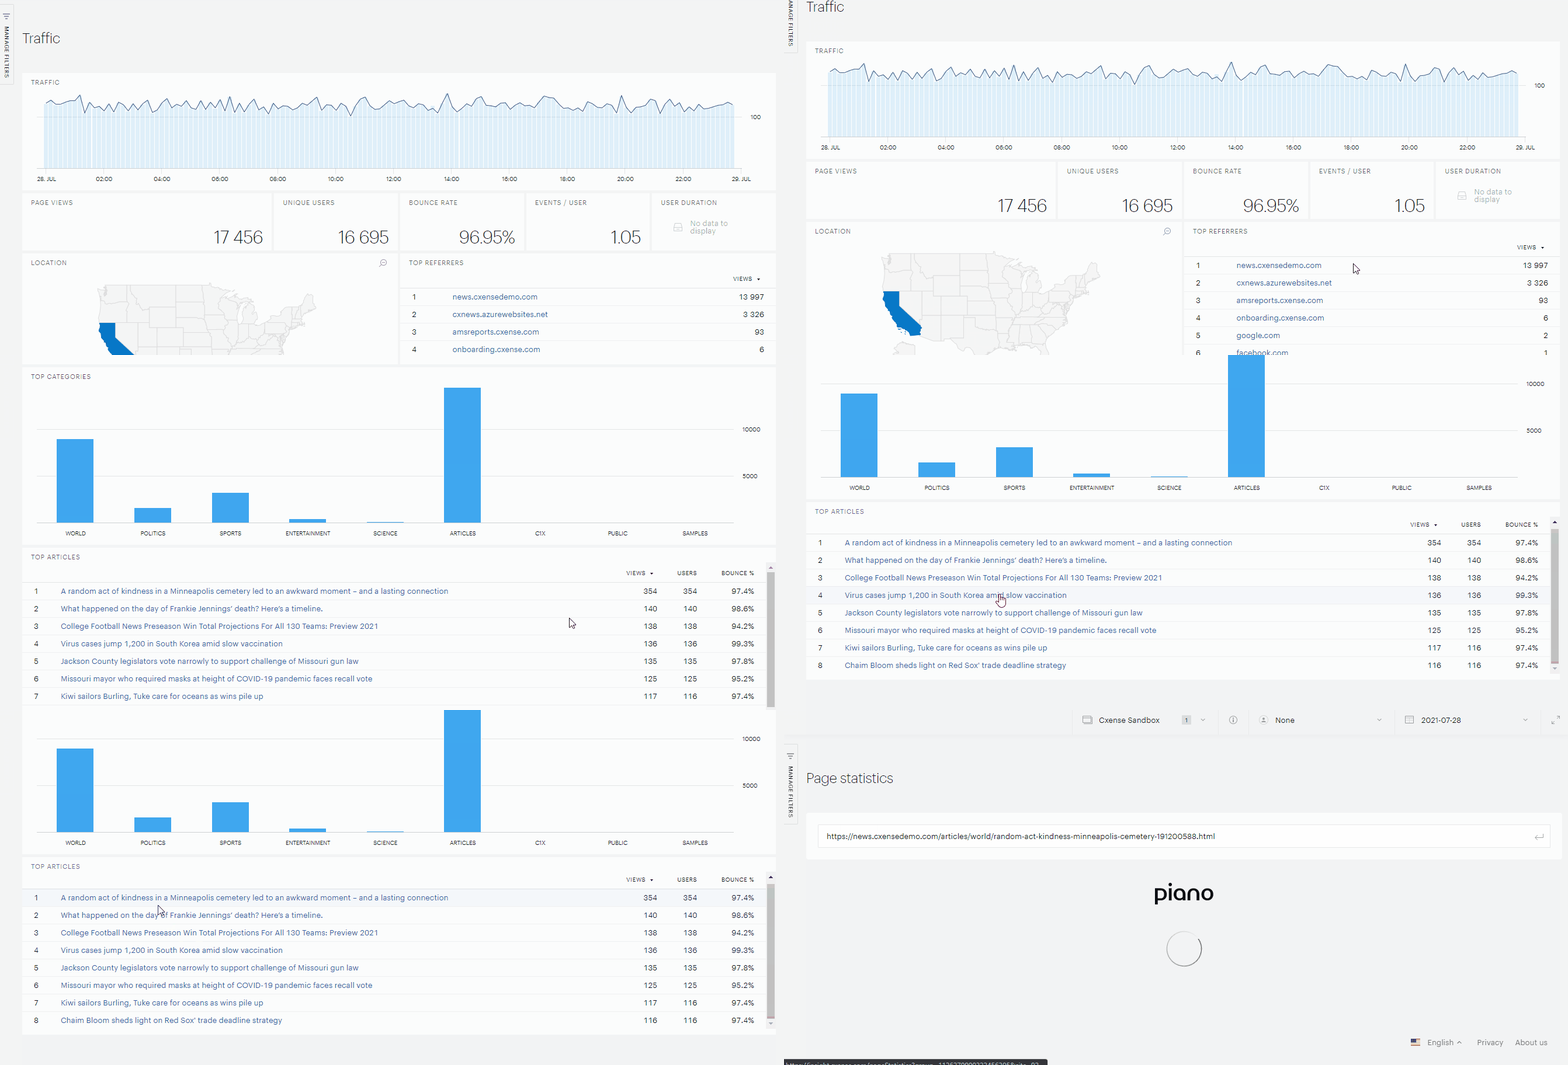
Now that you have set your site, time range, segments and all your filters, you can see Insight's readings for them. The starting page of the Insight dashboard shows the main metrics, a cross section of your actual traffic: numbers and tendencies for pageviews and unique users, total bounce rate, consumption according to regions, top categories etc. Note that clicking the title of an article in the top 10 articles will forward you to the page of that article (more about single article pages below).
Sources & destinations
Find a comprehensive analysis of the domains and sites (host/URL) your users came to your site as well as the domain / sites they went to.
Direct traffic, referred traffic.
Custom parameters
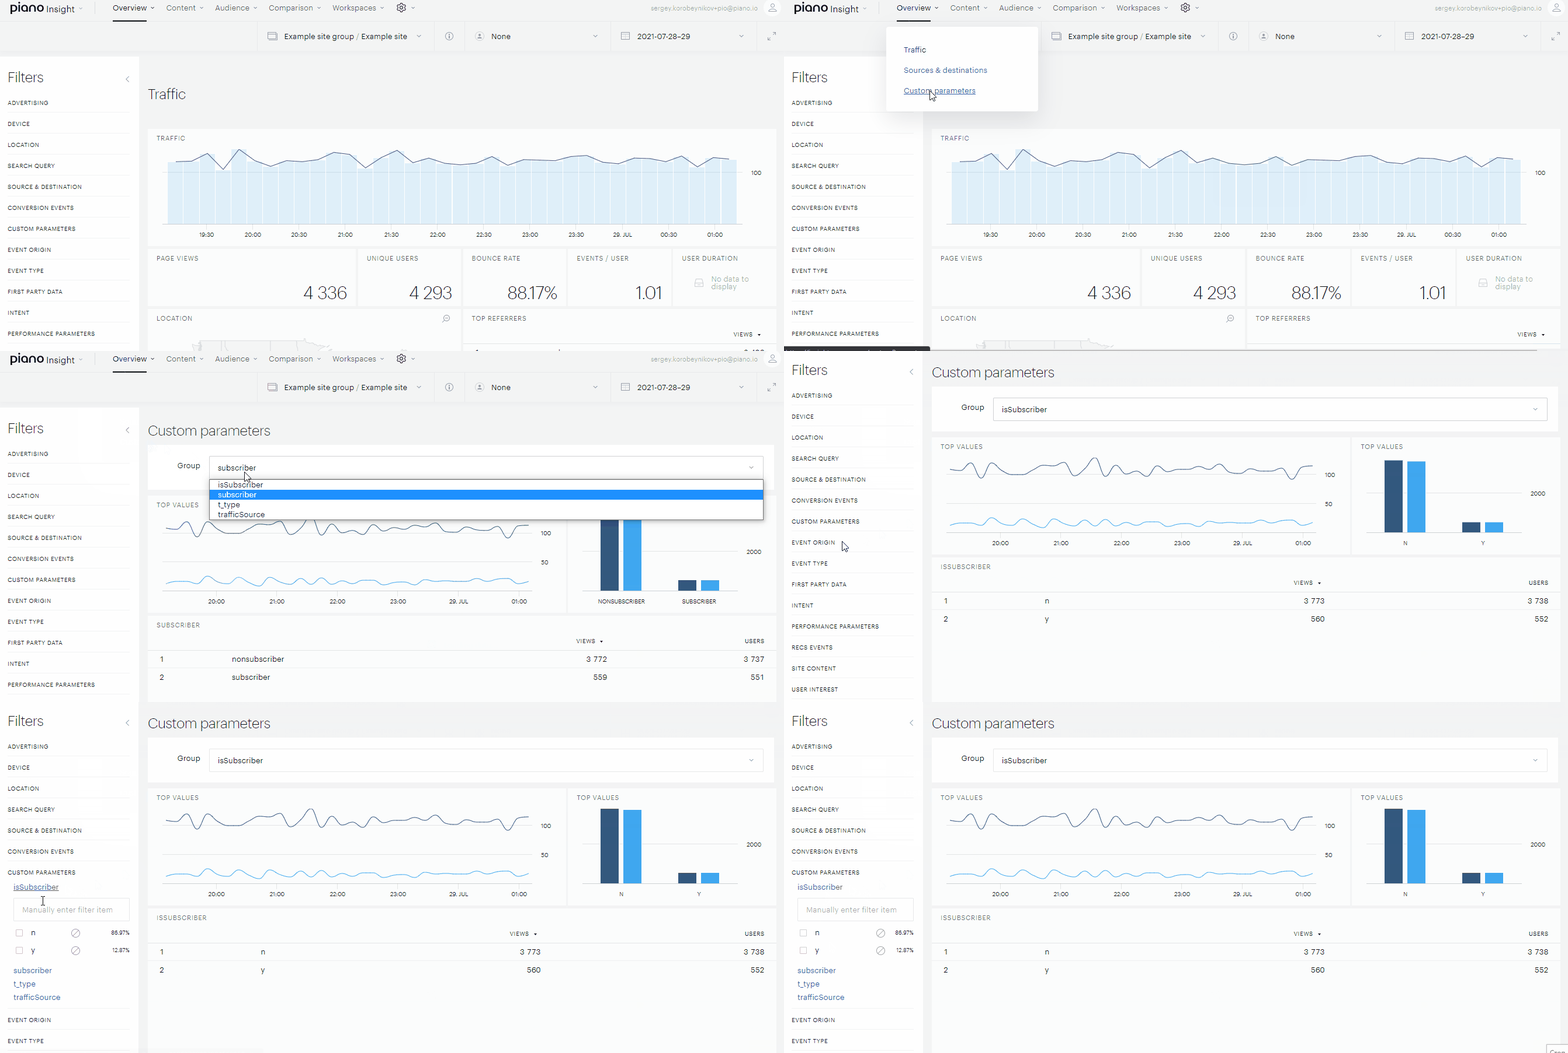
With Insight you can add a lot of custom filters to monitor virtually any aspect of your traffic and user behavior. Usually, a new pair of parameter/value is added to an article by your content management system, then the article is crawled and its content profile gets a new custom parameter. Custom parameters can also be submitted via JavaScript and/or URL (read more here).
In a dedicated dashboard you can select a parameter from the Group dropdown to view and compare all or certain values on graphs (use the checkboxes in filters to select values and the Manually enter filter value to find values you don't see on the top list).
Content button
Popularity
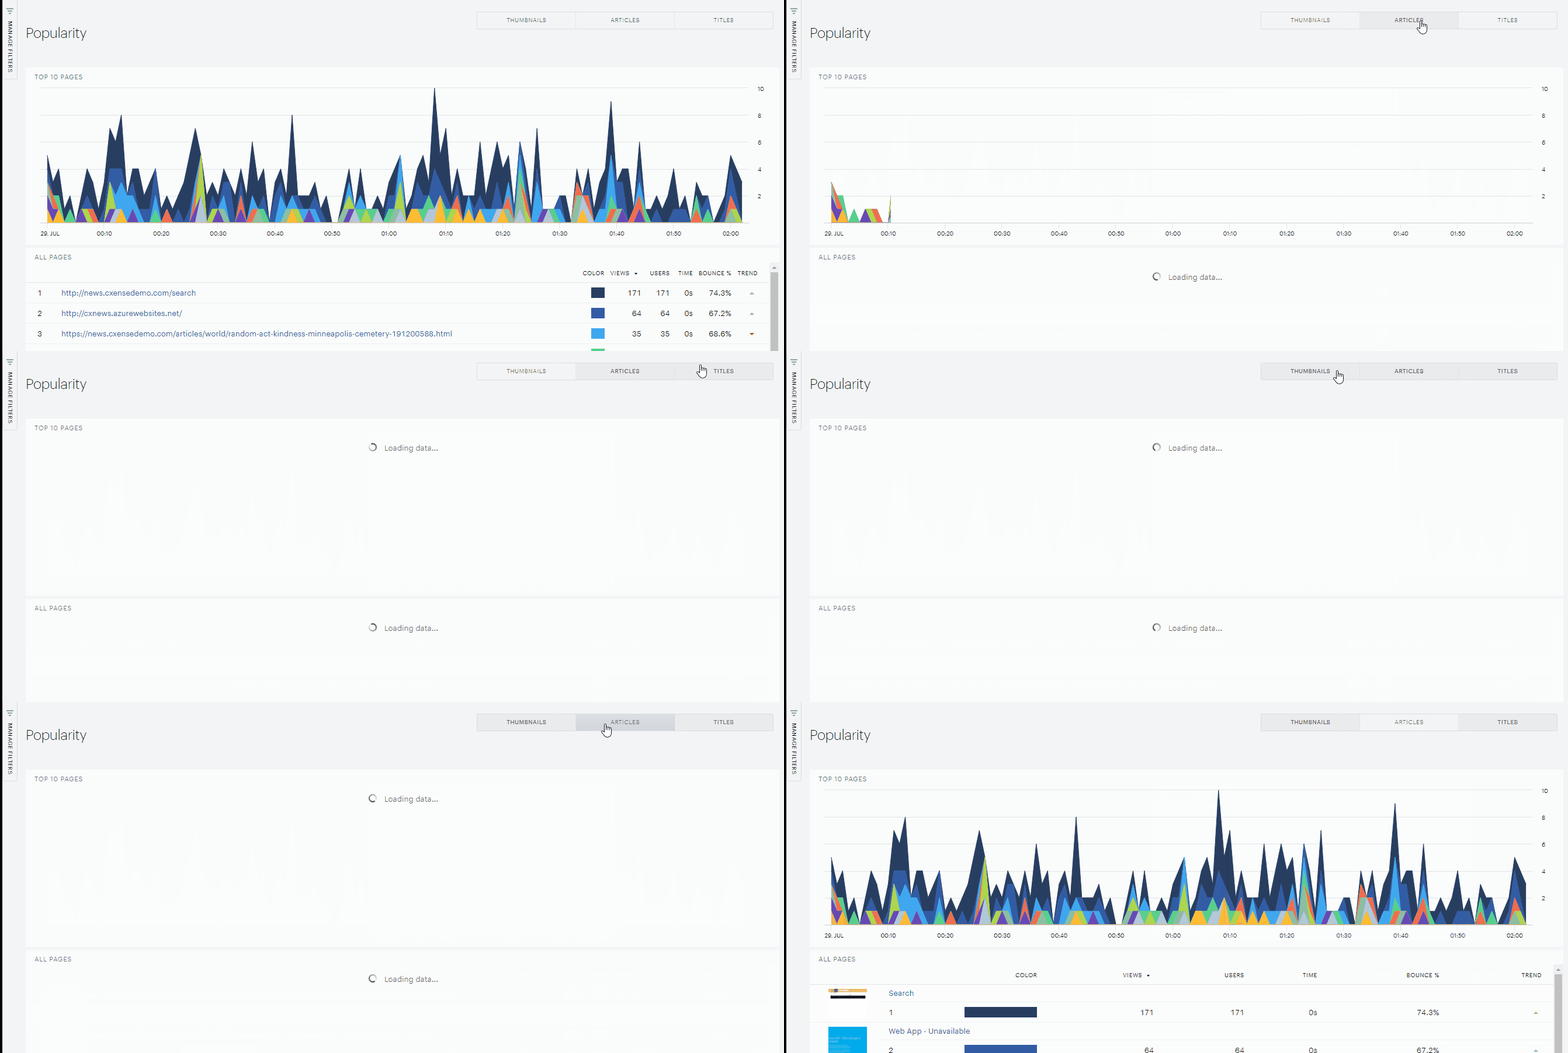
The graph presents the top 10 articles with high pageviews (like everywhere else, for a given time period and site or site group). The rating of all your articles (with their pageviews, users, time spent, bounce % and trend assessment) is given under it.
You configure the appearance of your articles in the list using the buttons in the top right. Note that when Articles is activated, the rating includes only pages tagged as pageclass:article and ignores, like in the example below, search pages which otherwise would normally be on top (as well as homepages and front pages). Pressing Thumbnails and Titles defines whether an entry in the list will contain only URL or the thumbnail and title too.
You can click any line of the rating to see its page statistics.
Page statistics
The results of traffic and linguistic analysis of an individual article are given on the tabs of its Page statistics. Usually you come to this page after clicking the title or URL of a page on various lists (Overview - Traffic, Content - Popularity etc.). You can also navigate here directly, via Content - Page Statistics, and enter the URL of the page you want to analyize.
The Page administration button in the top right will show the site properties and permissions. The crawling periodicity is a variable value depending on a few parameters, but you can click Schedule refetch to put the URL in a very high priority on the list of URLs to crawl. Within ~1 minute, that page will be recrawled, and any changes will be updated in our page snapshot and index.
-
Overview: Features the page's thumbnail, count of unique users and pageviews (both graphically and with numbers), average time a user spends on the page (avg. active time), when the page is the first one in a user's session (Session starts) and how often a user leaves the site after viewing this page (bounce rate), proportion of device types (desktop, mobile, and tablet), what domains tend to forward users to this page (top referrers), and what are the most relevant content and metadata keywords (top keywords).
-
Page content: shows you a page’s content profile created after crawling the article. You can see keyword values distributed by groups and ordered by weight. For a content-related keyword value, weight shows to what degree this keyword value is attributable to the article (max. 1.0). A keyword weight is higher when it stands in the article title and/or occurs in the article many times, especially in the beginning. It is also higher if there are few articles tagged with this keyword value. Read more about weight and other metrics here.
-
Referrer traffic: From what external hosts/URL users browsed to this individual article (except for search pages and social media).
-
Search & social: From what search engines and social media users got link to this article, what search queries were used.
-
Exit traffic: To what external pages users went from this article.
-
Audience: Audience broken down by location and device type
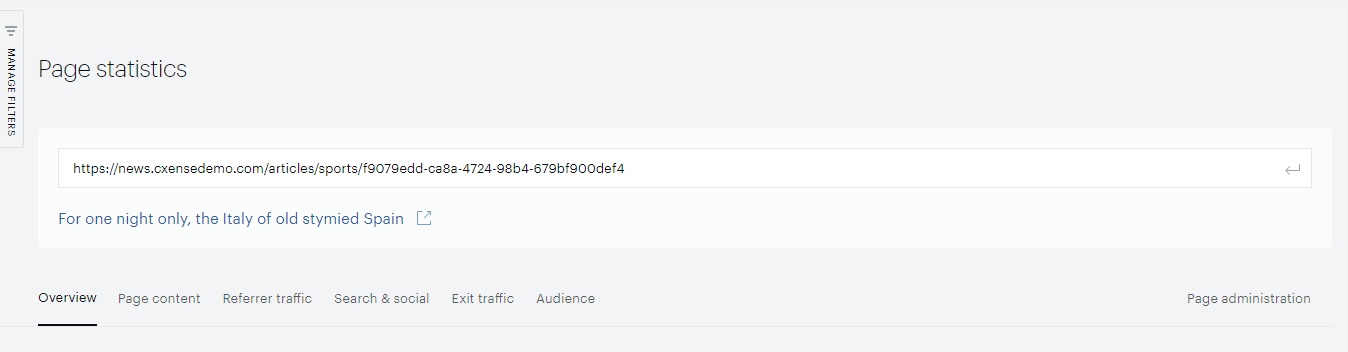
This window takes a closer view on the data of an individual page: pageviews and unique users, what was the bounce rate, how many times it was the first page of a user session and who was the top referrers to this page. In all diagrams you can hover on a specific sector to view the number of pageviews.
The top 10 keywords section shows the “keywords” from Content analysis (see the next tab) and their weight.
Site content
Select one of the content types / groups from the Group dropdown and view how your content is distributed among the values.
Audience button
Geography
Select among the locations of your traffic consumption. You can click the magnifying glass in the top right of the map to zoom out and then select one of the regions to take a closer look at it. Below are the users and pageviews broken down by coutry, city, designated market area etc.
Devices
Graphical and numerical statistics for different device types (mobile, desktop, tablet), mobile brand, operating system.Browser (browser version, screen resolution).
Interest
A user's interests are the prefixed categories that include the articles read by a user. For example, 50% of the articles they read over a certain period were tagged "sports", 30% - "politics", 40% - "entertainment", and 10% - "nature" (some articles may have more than one tag, so the sum may exceed 100%). Recorded as this user's interests, each of those categories has its individual weight reflecting how important this interest is for this user, relative to other interests. Weights are adjusted as the user reads more: increased for topics the user is reading about and decreased for those that have not been read in a while.
First party data
Customers can unite 1st-party data with the user ID of a user, which allows them to run analytics, target and create experiences based on this data. This is a very powerful feature that also includes 3rd-party data (useful for advertisers). Read more about 1st-party and 3rd-party data.
Comparison button
History
This feature allows to see how, for example, the performance of a team or author evolved over the last month. Just click the top right button to define two time ranges and explore the graphs and comparison of: pageviews, unique users, sessions starts, bounce rate, average pageviews per user, average session duration, new users. On the graph, you can switch between Hour, Day, Week, and Month to adjust the level of detail.
Dimensions
In this window, you can create a downloadable table showing statistics you assign rows and column by picking them from all the numerous parameters monitored by Insight.
Row dimension: Rows of the table will include values of this parameter
Column dimension: Columns of the table will include values of this parameter.
Row count: Number of rows displayed at once.
Number mode: Absolute numbers or related to total traffic
Field: Units to be shown in the table cells; for some rows / columns, you can select between multiple units
Download: Click to download the table as an .xlsx file.
Workspaces
This is where advanced users spend most of their time. Workspaces is a tool that satisfies more specific data requirements. All teams might be interested in a broad overview, however, team managers or authors are probably more interested in a subset of an entire site's traffic data. For example, to understand the weekly results for a certain author, you want a workplace where you can see the audience size and traffic of their articles over last week, find what articles have been most engaging, check if this author has reached their traffic goal etc.
As you click Workspaces, you are invited to either select an existing one or create new. You can create a new workspaces from scratch or use a template. A good choice to get started with, templates are generic, and at a certain point you come to creating your own workplaces from scratch or considerably rearranging templates.