
Overview
The Piano platform measures and produces reports a number of different metrics. Some of these are listed below along with an explanation of their semantics.
|
Metric |
Naming in the Insight API or workspaces |
Definition |
Also known as (synonyms) |
|
Pageviews |
events |
The number of times the Piano tracking script gets executed. Note that for some types of pages with lots of dynamically generated content (e.g., image galleries or AJAX applications), the technical notion of a pageview might not be entirely 1-1 with how a user experiences the page. |
Page impressions, PI, PV |
|
Visits |
sessionStarts |
The number of initiated sessions. A session times out after 30 minutes of inactivity. Thus, if a user views a page and leaves their computer and then after 29 minutes returns and opens another page, that's still the same session and thus still the same visit. If a user views a page and then leaves their computer and returns after 31 minutes, though, that's counted as another visit. |
Session |
|
Bounces |
sessionBounces |
The number of sessions having only a single pageview. |
|
|
Unique users |
uniqueUsers |
The number of unique user identifiers seen. Typically, this equals the number of different Piano cookie values seen. By default, no cross-device user consolidation takes places, so a person having two different devices will be counted as two users. Similarly, a browser shared by multiple people will be counted as a single user. |
Unique clients, UC, UU |
|
Unique URLs |
urls |
The number of unique URLs visited by users during the period. A unique URL is an identifier that takes you to one and only one page. This metric is available only when the selected period is shorter than or equal to the last 24 hours. Note: a collection of 10 unique URLs will take you to 10 different web pages. A unique URL is different from an "URL" in the sense that many URLs can indeed point to the same page even if they look different.
One important step of securing that the URLs we are counting are unique is normalization of URLs. A normalized URL is the "base form" that we count pageviews against on our backend. A normalized URL can be a canonical URL, but it does not have to. Example: if PVs are 100 , unique URLs are 10, possible scenarios could be:
|
|
|
Active time spent |
activeTime |
For Piano to track a user's active time, we recognize once a user tries to switch a tab or even closes the page. The respective browser APIs allow us to use these standard events to measure this metric. This is an efficient method but also results in averages being computed for less than 100% of the page views since we see some technical limitations, such as a bad internet connection or a limited payload size when sending the events. |
Dwell time, average active time, activity time |
|
Attention score |
weight |
A measure that combines pageview counts with content profile weights. In some profiles, a certain concept might be very prominent and highly weighted, whereas in another profile the same concept might have a very low weight. When aggregating over the traffic events associated with profiles, these weights are then factored in |
|
|
Scroll depth |
scrollDepth |
The average percentage of the page area a user scrolls through during a pageview. |
|
The Piano platform recognizes robots that clearly identify themselves as such, and excludes traffic from them in the reported metrics. So, e.g., when reporting the number of pageviews, this reported count does not include requests made by identified robots.
Basic and calculated metrics
Certain Insight widgets, for example All traffic, introduce – in addition to our basic or raw metrics listed above – some additional calculated ones.
Basic metrics are directly available as a result field from a Insight /traffic API request (except for weight which is available through traffic/keyword). Calculated metrics interpret different combinations of the basic metrics to produce more meaningful insights. They are generated on our frontend and cannot be passed via API.
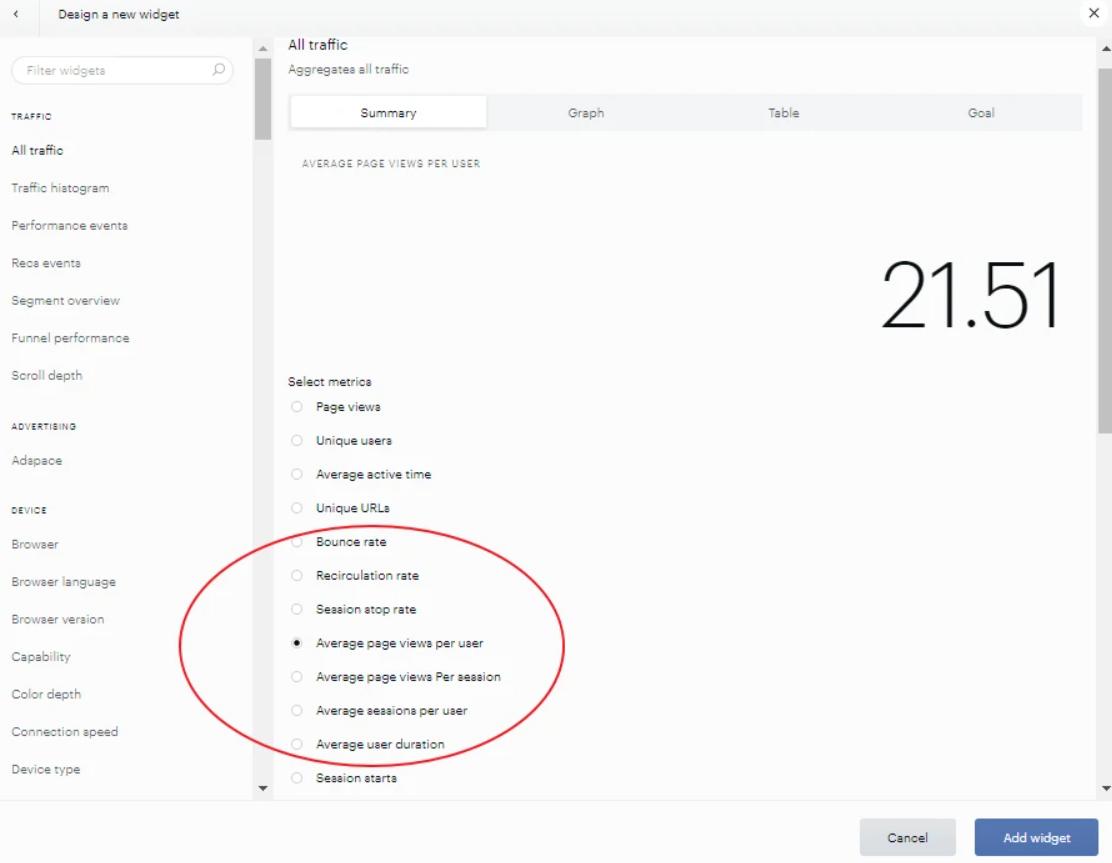
Table of calculated metrics
|
Calculated metric |
Definition |
Formula |
Example calculation |
|
AVG PAGEVIEW PER USER |
How many pageviews an average user generates. |
|
3.659.451 / 562.581 = 6,5 |
|
AVG USER DURATION |
Average total active time (dwell time) per unique user across all sessions in the reporting period. |
|
47s * 3.659.451 / 562.581 = 305,7 = 5m 6s |
|
SESSION STOP RATE |
How often (in %) a user leaves the website (on a certain page). |
|
813.389 / 3.659.451 * 100 = 22.2 |
|
BOUNCE RATE |
How often (in %) a session consists of a single pageview. |
|
227.505 / 879.273 * 100 = 25.87 |
|
RECIRCULATION RATE |
How often (in %) a session consists of more than one pageview. Opposite to bounce rate, actually derived from it. |
|
(1 - 227.505 / 879.273) * 100 = 74.12 |
Trends
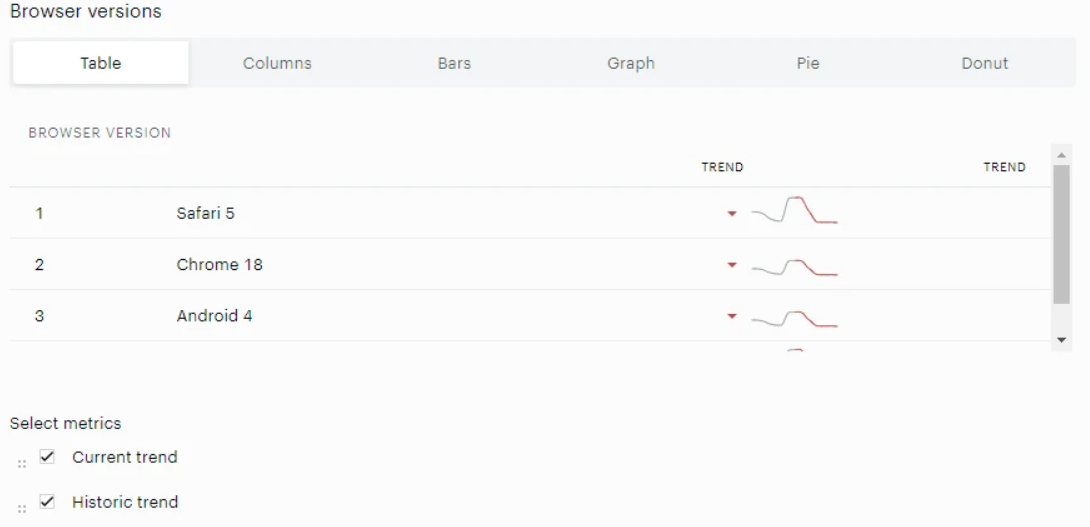
In addition to the numeric values of the metrics, some widgets in the preset and custom workspaces also offer to show the current trend and the historical change of the pageviews.
We will explain the contents displayed when Current trend and Historical trend are selected in the URL widget.
Current trend is judged by dividing the period selected by Insight (or the period specified by the widget) into two and by comparing the number of PVs in the first half and the second half. If there are more in the latter half, it will give a green upward arrow, otherwise it will be a red downward arrow.
Historical trend is a miniature graph showing the transition of PVs in the period selected by Insight (or the period specified by the widget).
Discrepancies with 3rd-party tools
When comparing different web analytics tools, there will always be a discrepancy in the reported numbers. The reasons for the differences might vary, and it is normal to experience discrepancies up to 10% between different tools. In cases where you are experiencing larger discrepancies (>10%), you should look into the reason for this. The purpose of this page is to give you an introduction to how Piano measures and reports different metrics in Piano Insight. It also lists some potential reasons for the discrepancies to other analytic tools and provides some potential reconciliation steps.
Note, it is impossible (or close to impossible) to get exact numbers between different analytics systems - but following the steps below will reduce the discrepancies to a reasonable percentage:
-
Ensure that both systems’ analytics tags are present on the same set of pages. Use browser’s developer tools.
-
Ensure that both systems’ analytics are sending the same set of events the same number of times. Use browser’s developer tools.
-
Check reporting of non-page-load events. Refer to AJAX web applications.
-
Check reporting of events where the same URL is refreshed (does not change) – Refer to Page refresh.
-
Check the difference in placement of the two analytics tags. If there is a JavaScript error on the page between the two tags that causes JavaScript evaluation to be aborted, events will not be reported into the system having the bottommost-placed tag Use browser’s developer tools.
Other possible explanation(s) for variance in pageviews (PV) and/or unique users/visitors (UU/UV) are:
-
The two systems might not be measuring traffic over exactly the same time period. E.g., the two systems might differ in when they define that a day starts and ends and how they handle time zones.
-
The two systems might differ in how they detect robots and how they report such traffic. E.g., one system might detect a given request as coming from a robot, whereas the other does not.
-
One of the systems is under the attack from Ghost referrers. Make sure that the systems are protected against this. Read more here.
-
The two systems might handle non-JavaScript clients differently. E.g., one system might not count visitors that do not have JavaScript enabled.
-
The two systems might count things differently. E.g., one system might report estimated counts using sampling whereas the Piano platform provides exact counts.
-
The two systems might report data back at different times. E.g., if the user navigates away from the page before any asynchronous reporting of data takes place, some events might not be reported.
-
The two systems have different approaches for counting unique users. Some analytic tools rely only on third-party cookies. Safari rejects third-party cookies, so all the Safari browser users will be counted as new users in every new session.
For discrepancies in the mobile advertising setting, this IAB whitepaper gives detailed explanations of common discrepancy causes for mobile campaigns.
Note on unique user numbers difference in Piano vs other tools
We count unique users based on several user identifiers, including first-party cookie, third-party cookies, local storage etc. Hence, we do not simply rely on third-party cookies or IP addresses for identifying users.
For example, for users in corporate offices, almost all employees are assigned with the same IP address, which would result in underreporting on the actual number of users using conventional IP-based counting for devices that do not support third-party cookies.
Hence, the Piano Insight analytics tool will also count accurately each of the employees and assign them unique user IDs, while other tools might assign only one unique user to all these employees.