
cX::ad Report Overview
The reporting framework has been built to provide users with powerful tools with which to optimize inventory management.
Reporting page components
All reports share similar components as shown in green below.
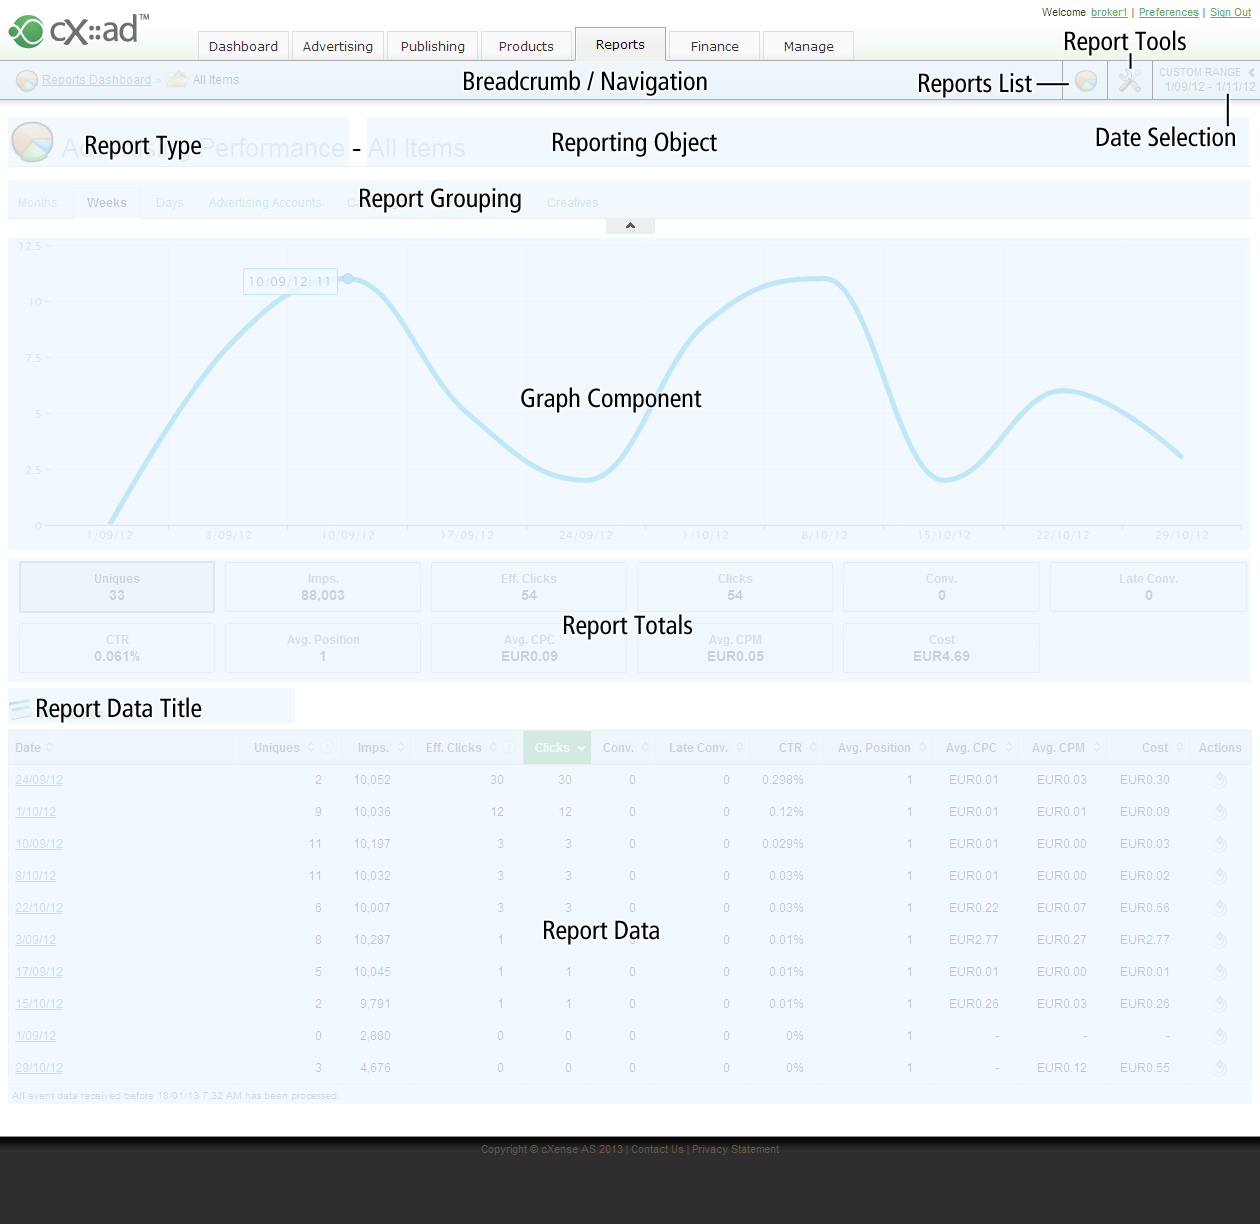
Current Report Location
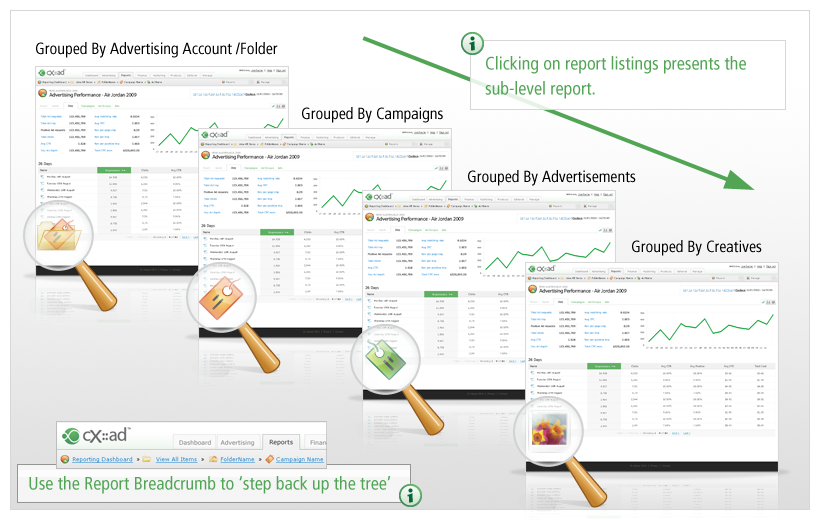
The Breadcrumb shows the current location of 'where' the report has been run. Clicking on parent object links will re-run the same report at a higher level. This allows the user to browse down through their hierarchy of system objects (eg. Advertising > Adv. Account > Campaign > Ad > Creative), and then browse all the way back up to their Advertising folder, without having to specify the same date ranges, report types, and grouping options.

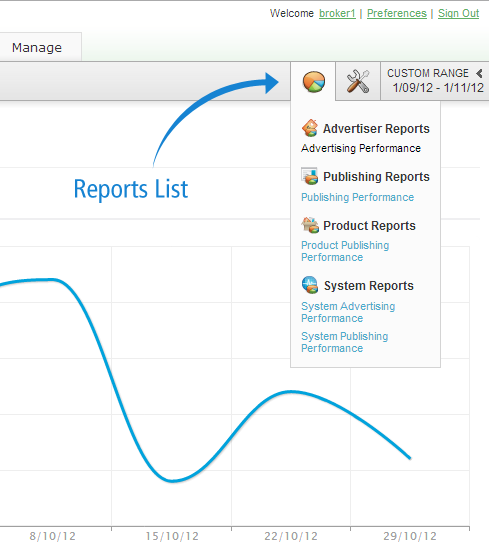
All Reports List
Present on every reports page, this drop down list provides quick access to all reports available to each user. Note, diffeerent roles provide different permissions to report access.
Report Name & Current Object Name
Every Report includes a page title including the report name and the Object for which the report has been run, separated by a hyphen ('-'). for example "Advertiser Performance Report - Shoes Campaign". You can change the current object at any time using the page breadcrumb to see a parent object (see 'Current Report Location' above), or selecting a child object within the tabulated listing (see Object Listing table' below).

Report Date Range - Quick select & custom
The UI provides some preconfigured date ranges for quick access to often used ranges.
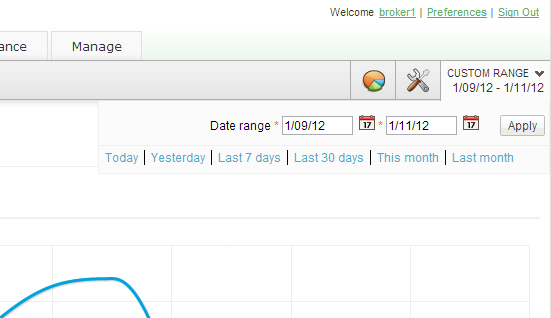
The following table specifies the time ranges within each data selection:
|
Quick selection Item |
Description |
|---|---|
|
Today |
From 12:00:00:01 this morning, until the time the report was run |
|
Yesterday |
The entire 24 hour period of Yesterday |
|
Last 7 Days |
Last 7 days, inclusive of the current day (anywhere from ~144 hours to 168 hours) |
|
Last 30 Days |
The previous 30 days including part of current day (anywhere from ~696 hours to 720 hours) |
|
This Month |
All hours of all days of the current calendar month |
|
Last Month |
All hours of all days within the last calendar month |
|
All Custom Selections |
The inclusive period between the start and end dates. |
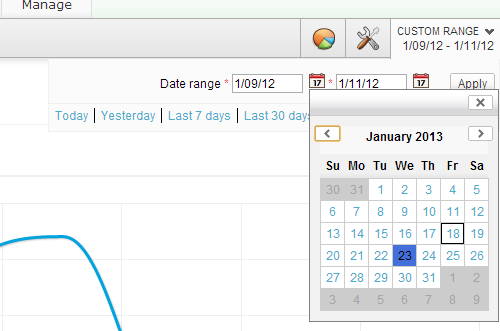
Additionally, users can specify any set date range required by manually entering a date range, or selecting a date using the date picker.
Object Type Selectors
These tabs select the object grouping type for the report. The ability to rerun the same report, for the same date range comparing different object types allows insight and clarity to well performing and under performing objects in the system.

Object Listings Table
The object listing table lists the items as selected within the 'object type selectors' (see above), for example months, accounts, campaigns.
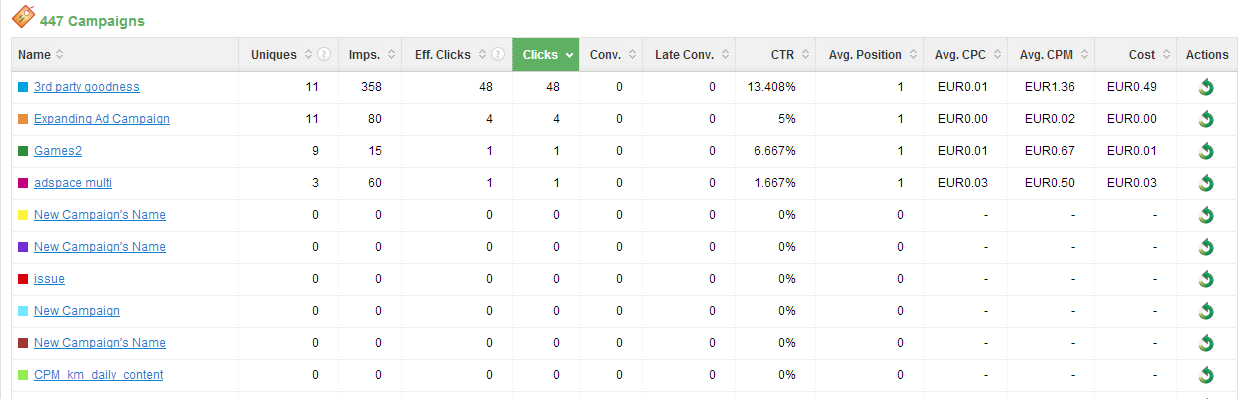
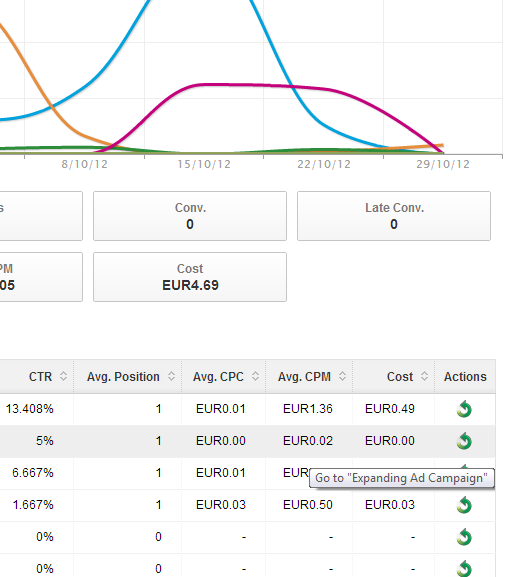
When a specific object is selected from the object type selection, the resultant listing also includes a 'go to' link allowing a single click to go to that object's management view. This option is not available for date range object types (day/week/month).
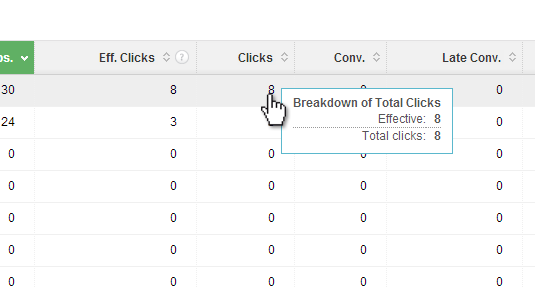
Click Breakdown
System wide Fraud settings affect data aggregation within reports, such that some clicks might be considered fraudulent. Hover the cursor over the Clicks data point to see a breakdown of the Total Clicks Vs Effective clicks.
Report Totals
Some reports may run across many pages. The Report totals are always presented and show the totals for the entire report. When the Graph component is expanded, the totals become buttons toggling the graph view.

Note also, the totals may differ slightly when compared to the individual sums shown in the report table, this is due to rounding errors for display (+/-3 decimal points). Any report total that includes the term 'average' is the addition of all sums, divided by the number of sums, as opposed to the addition of the averaged sums.
Graph
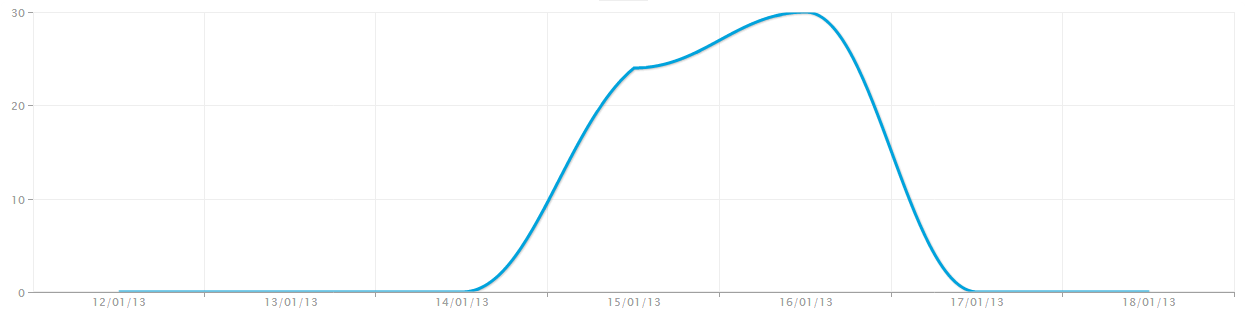
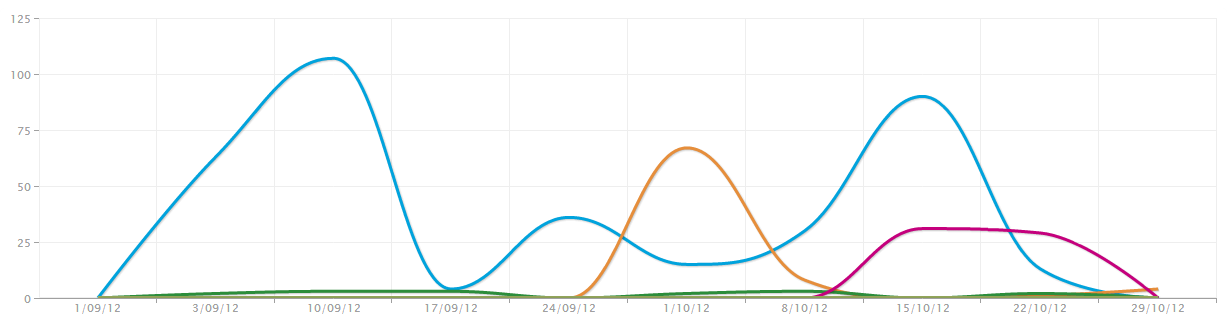
The visual display of the report data. The graph can modified by selecting either a different report total, and/or sorting of the tabulated objects. Hovering over the data points will present the data relevant to that object.
If a date type is selected (day/week/month) the graph presents as a single trendline.
If an object type is selected (Campaign/ AdSpace etc.) the graph presents the first 10 items in the reports listings table.
Interaction Guide
The Advertising Performance report (APR) is actually 18 separate reports containing 6 base comparison data points (the report totals/ columns within the table). As highlighted in the graphic below, the User can quickly and easily toggle between an account performance and campaign performance, at a particular 'object level'. Selection of the tabulated list items then provides the same report, grouped by the child object. For example, viewing the Advertising Performance Report (APR) of a particular campaign, sorted by advertisement, selecting an advertisement from the object list then redraws the APR at that Advertisement level, listing all creatives (child objects of the Advertisement).
For specific information regarding each report, refer to Advertising Performance and Publishing Performance reports pages.