Reports in CCE
Cxense Conversion Engine provides vast real-time reporting to provide insight into your campaigns, audience and content data. This section of the guide provides a short description of the purpose and content of each report available.
Campaign Performance Report
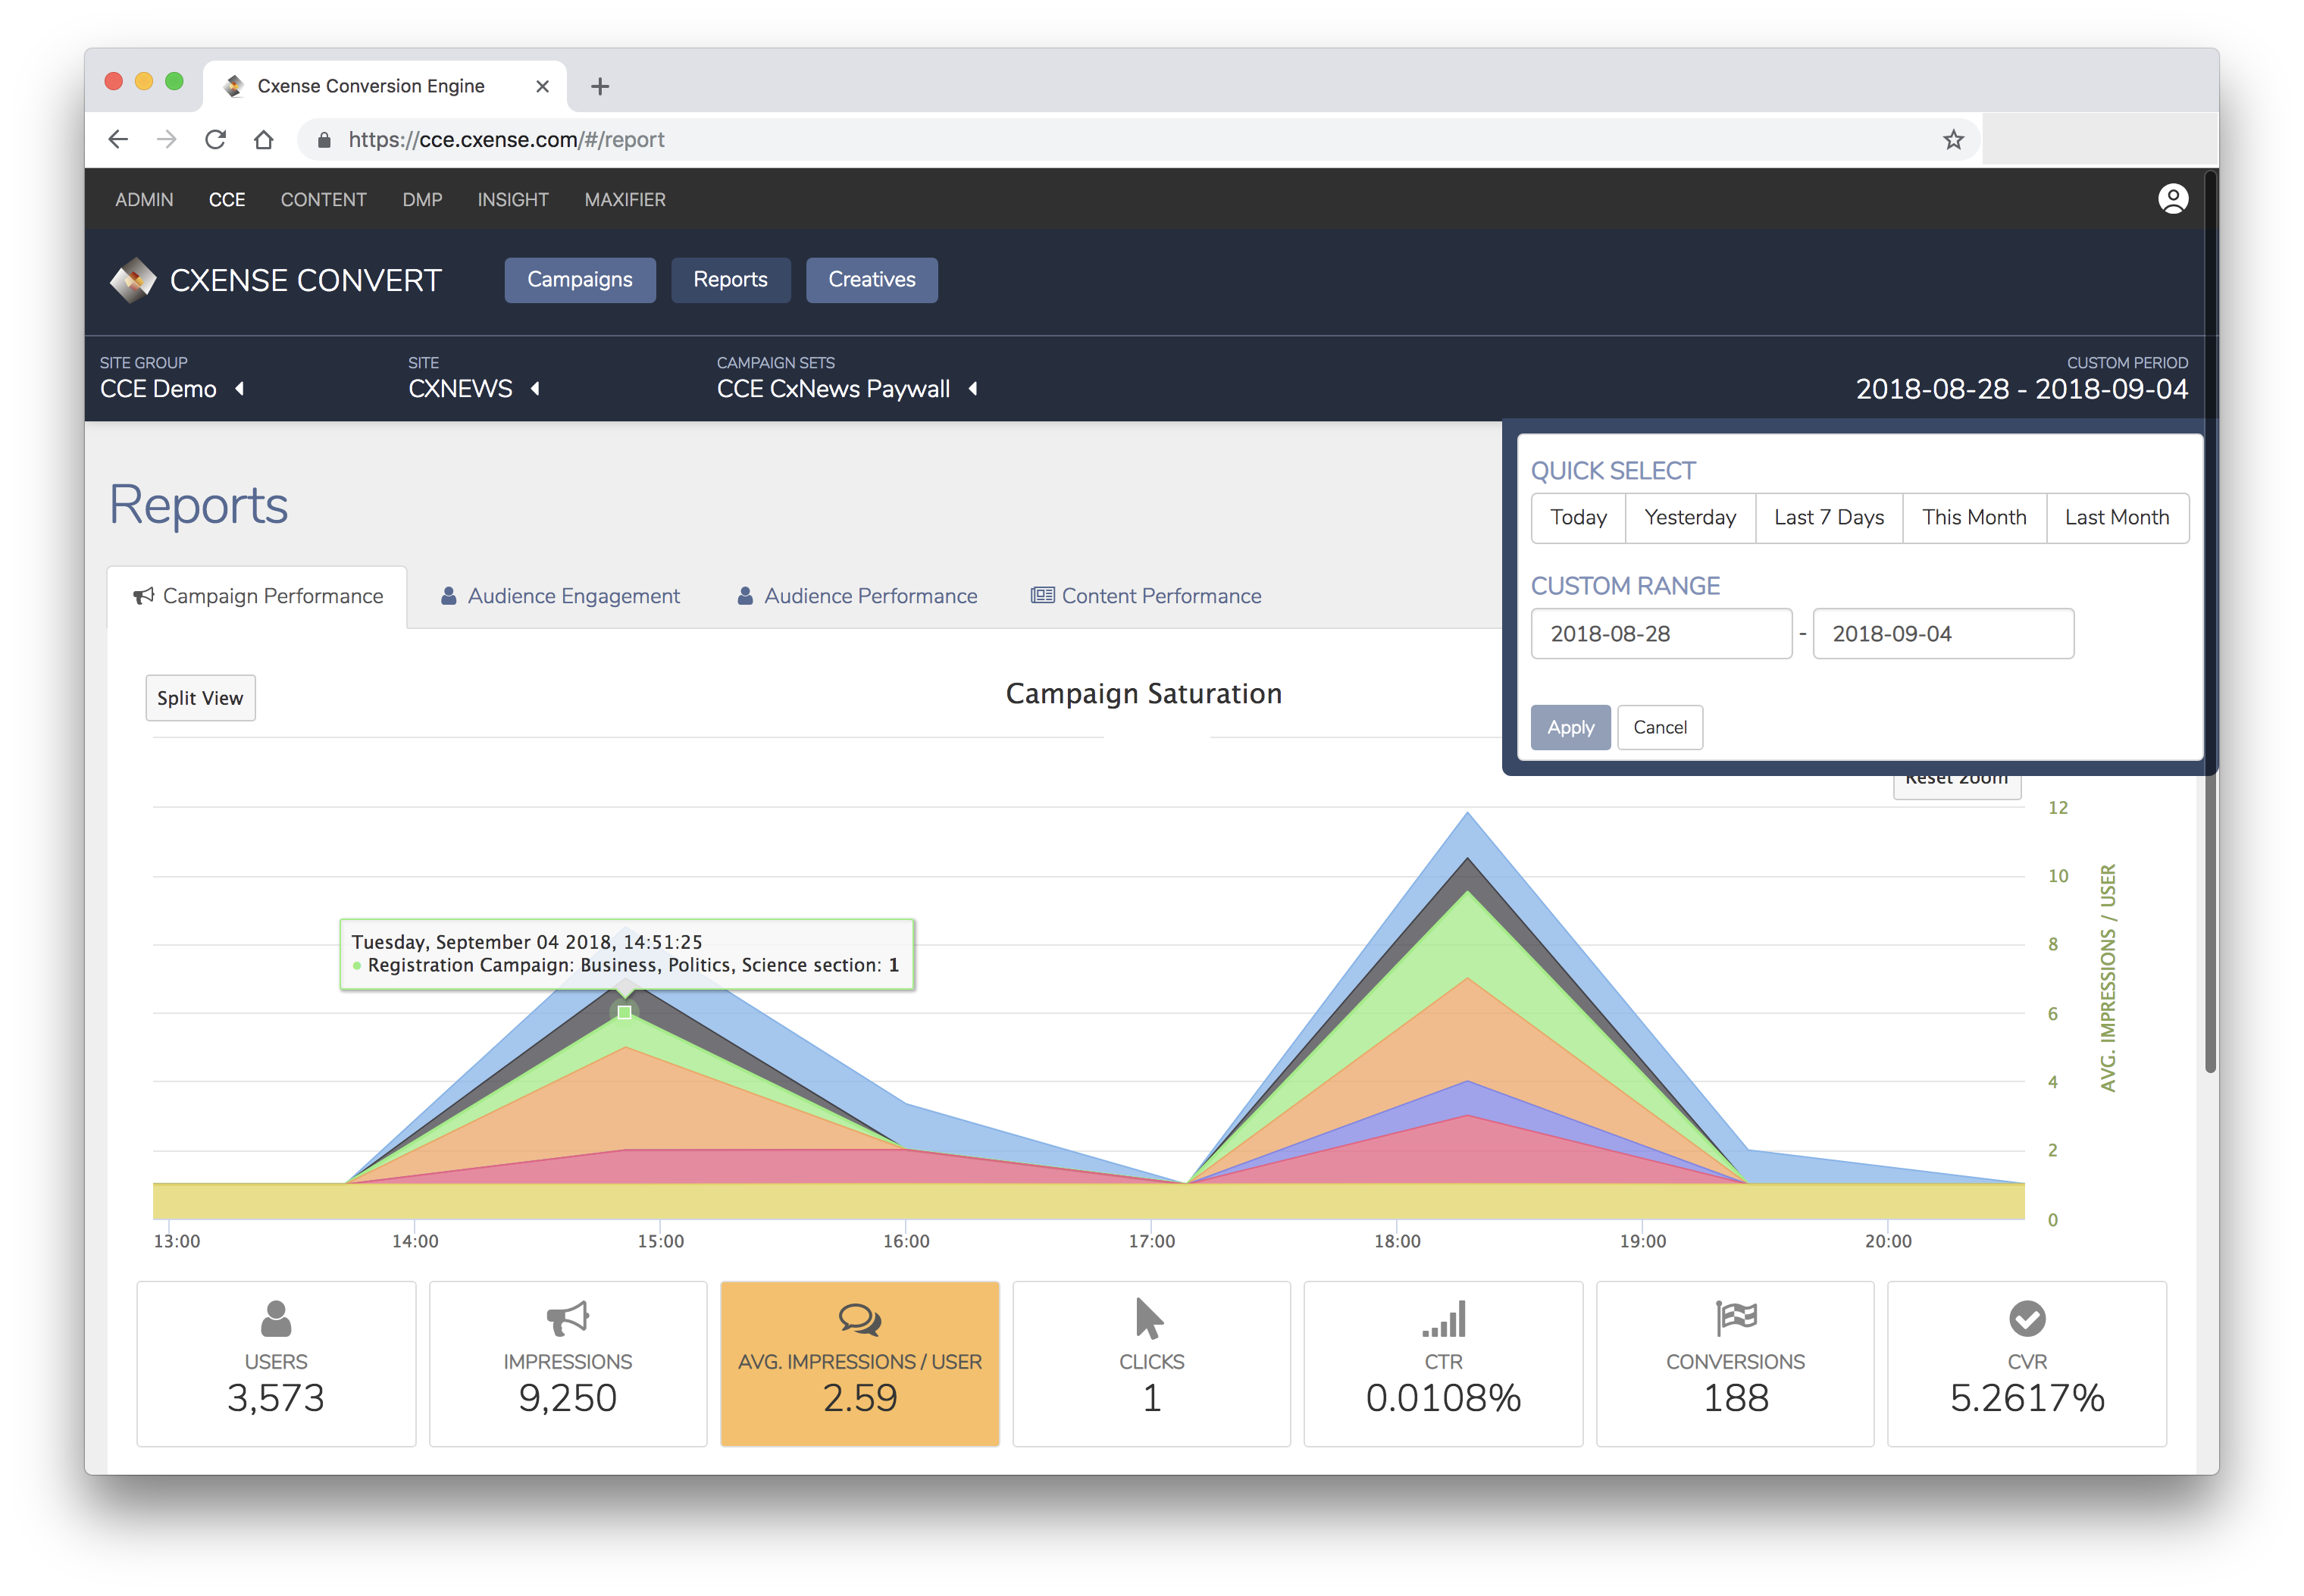
The Campaign Performance Report provides the performance results for campaigns created in the selected Campaign Set over a defined time period. To adjust time period, select one of the pre-set time ranges or set a custom date range at the top right-hand corner. Alternatively, you can zoom in to a specific range by marking a time area directly on the graph.
The graph shows the results per campaign for the defined time period. By default, it is shown in the Stacked view. The statistics for all campaigns of the selected campaign set is shown as accumulated, to give you an idea of how the Campaign Set is being delivered in total. To analyze each Campaign separately, switch to the Split view with the button in the top left corner of the graph area.
Placing the mouse pointer over the data point on the graph shows additional information: the name of the campaign and the value of the metric for it in the given time.
The graph can display any of the following metrics - select one with the buttons under the Graph area:
-
Users
-
Impressions
-
Average Impressions / User
-
Clicks
-
CTR (Click Through Rate)
-
Conversions
-
CVR (Conversion Rate)
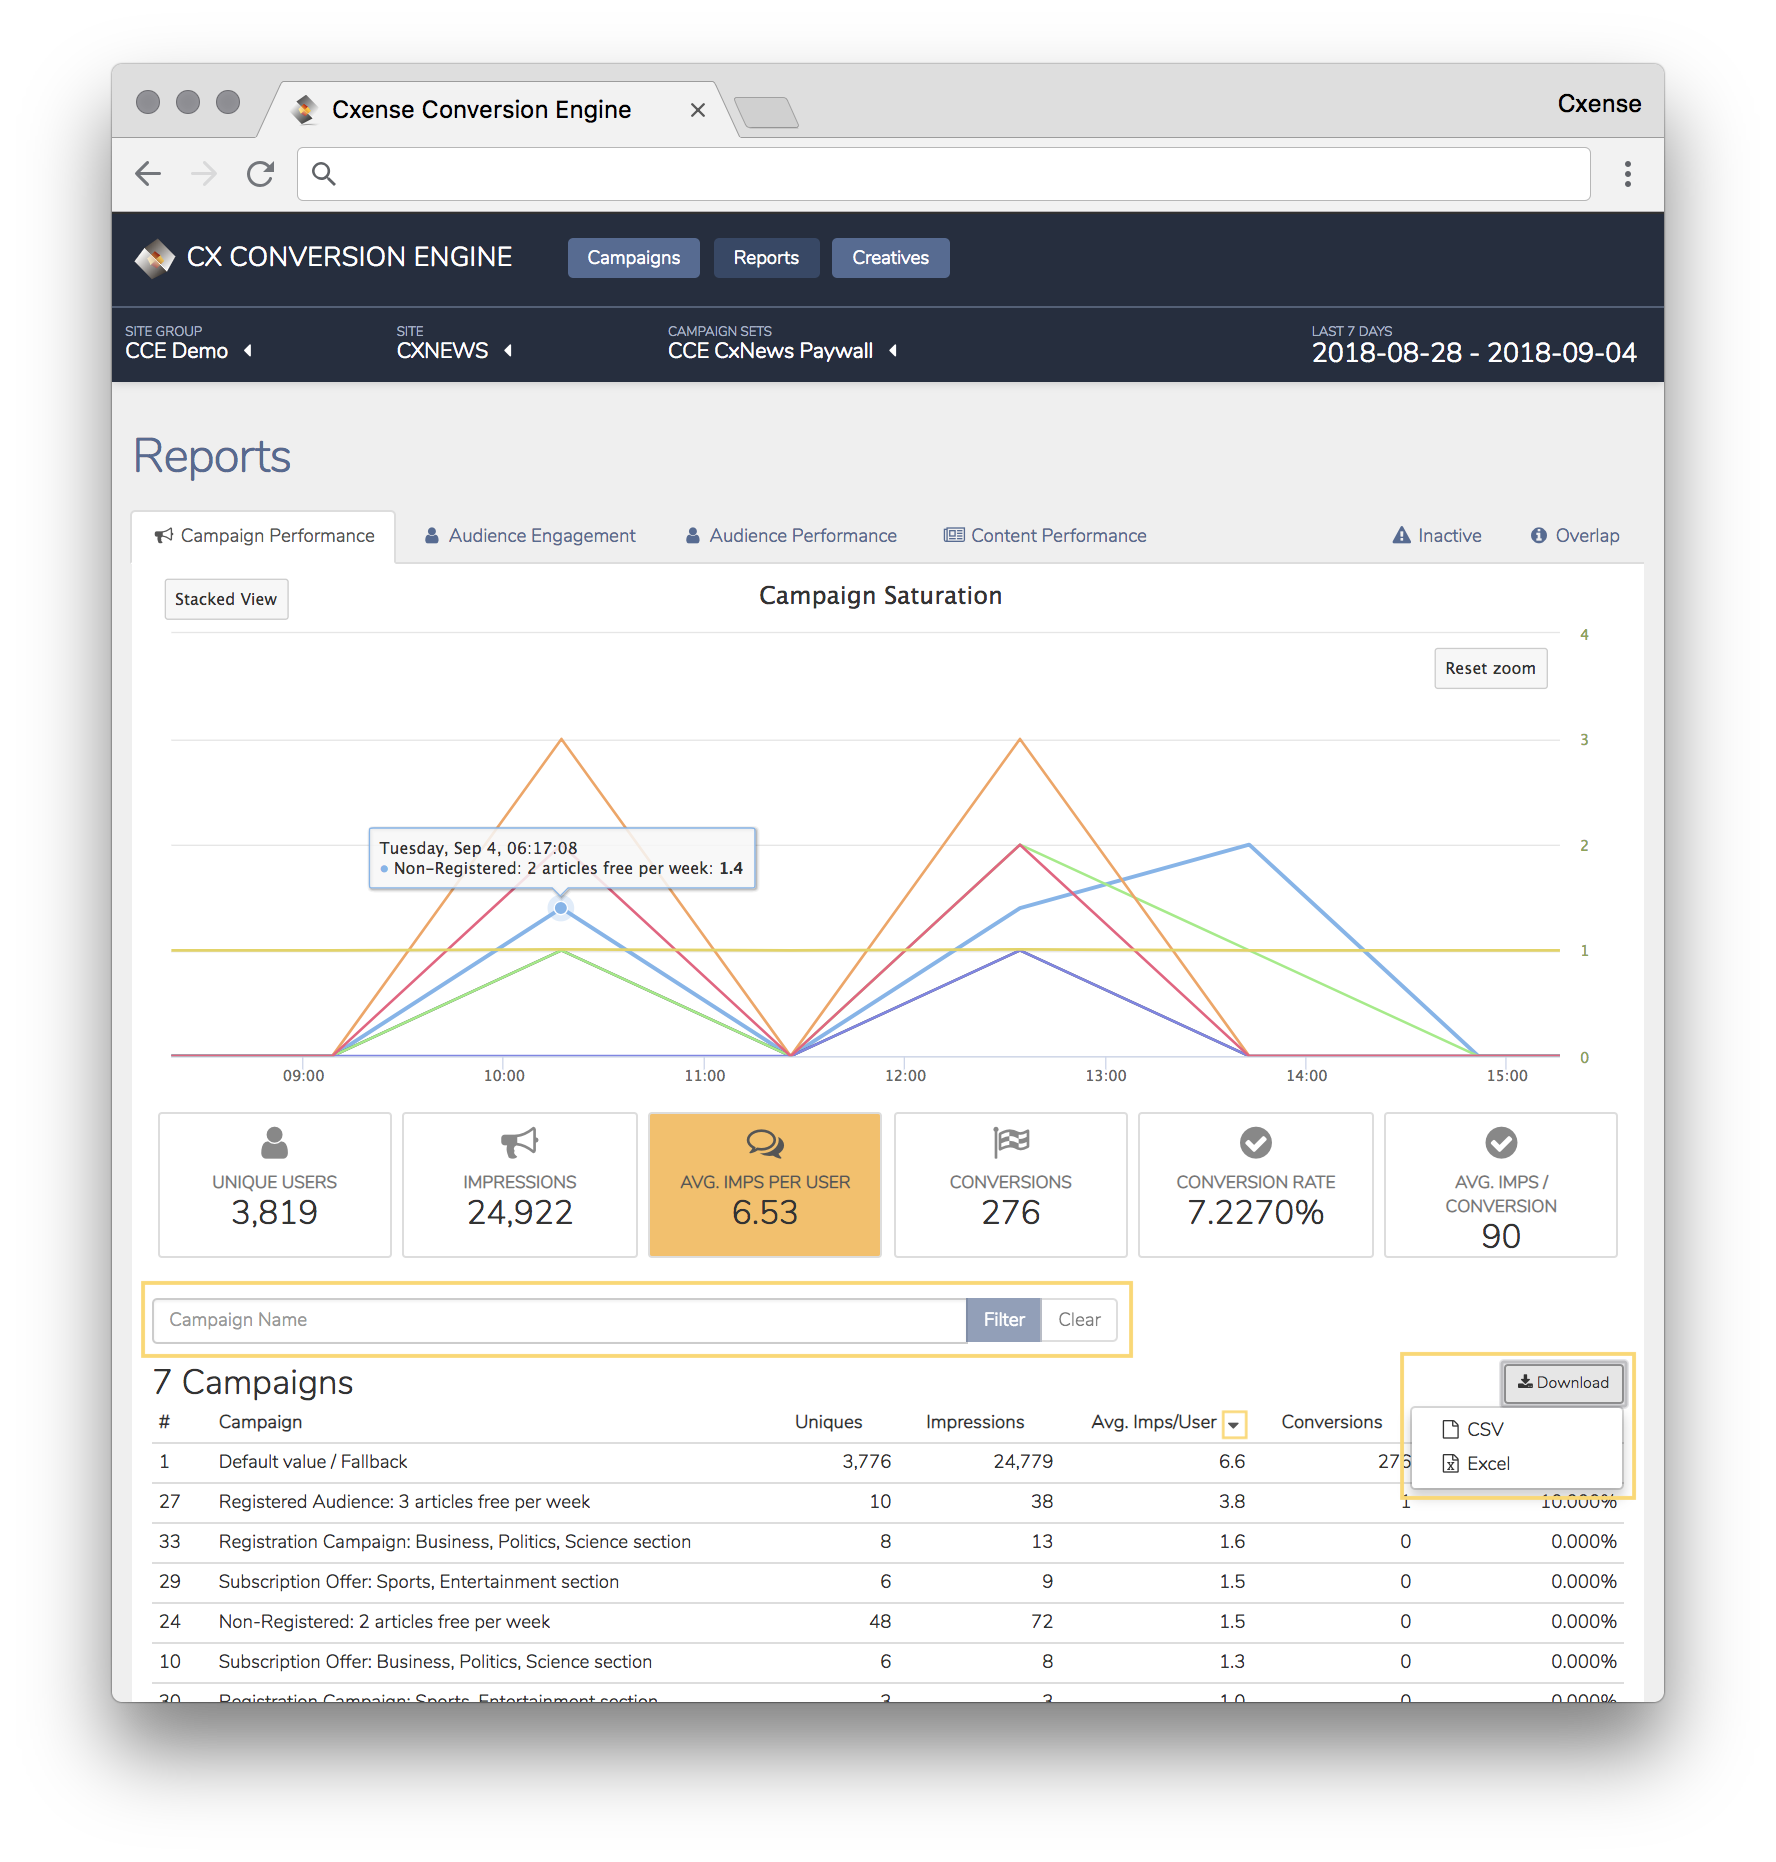
The table below the graph shows the list of campaigns and the results. Clicks and CTR (Click-Through-Rate) are two additional metrics available in the table. Please note that the data is shown for the time range selected with the Period filter in the top right corner (not the range you may have zoomed into on the graph).
You can sort the table by each of the available columns, filter the campaigns by name, or export the table in .csv or .xlsx format for further usage. Filtering the campaign list will affect the data shown on the graph, and the totals of the metrics.
Audience Engagement Report
The Audience Engagement Report provides insight on page views consumed for different Audience groups for the Site selected. To adjust time period, select one of the pre-set time ranges or set a custom date range at the top right-hand corner.
There are three Audience group types displayed in the graph:
-
All
-
Converters
-
Customer subscriber types (custom parameter)
The X-axis represents the number of page views consumed over a selected time period. There are two Y-axis: The black Y-axis is only associated with the Audience group "Converters", the blue Y-axis represents numbers of users and is associated with Audience groups "All" and all "Customer Subscriber Types", both represents the number of unique users but with different a scale.
The legend under the graph is clickable, to allow you to explore only the Audience groups of interest, e.g. to analyze the page views by Converters only, you can unselect "All" and all "Customer Subscriber Types".
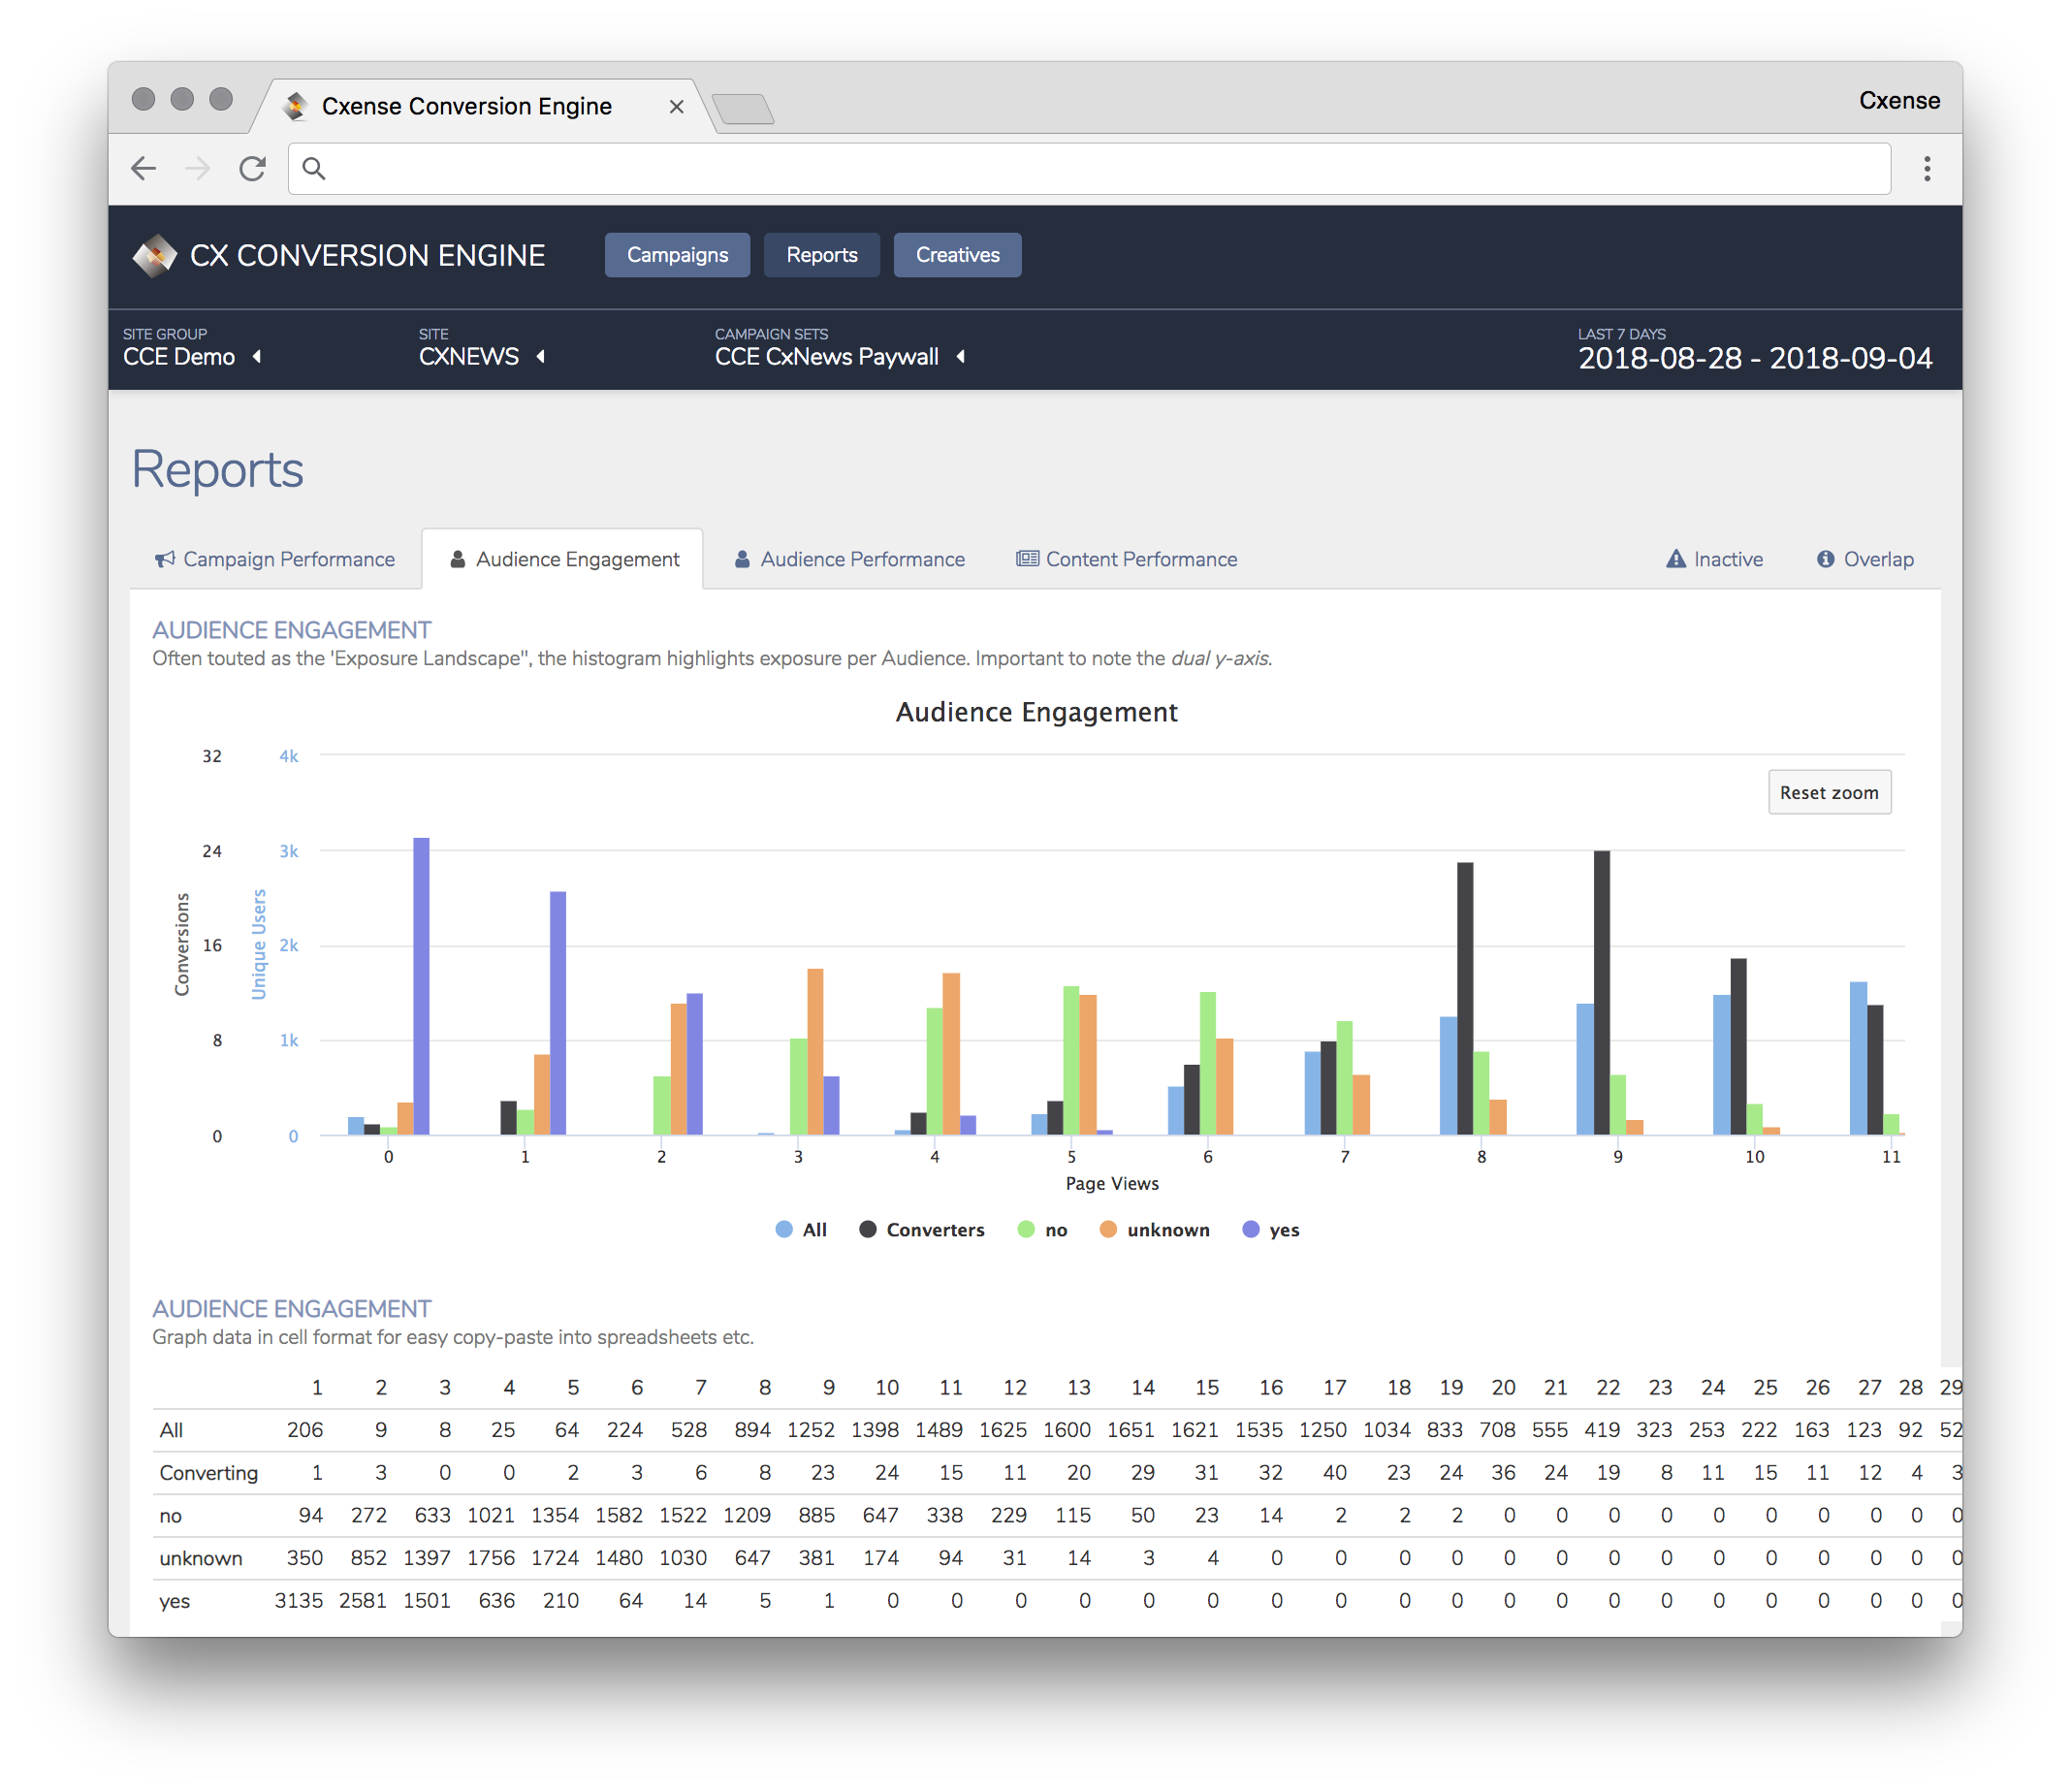
The matrix below the graph represents the data associated with each bar for all Audience groups.
Audience Performance Report
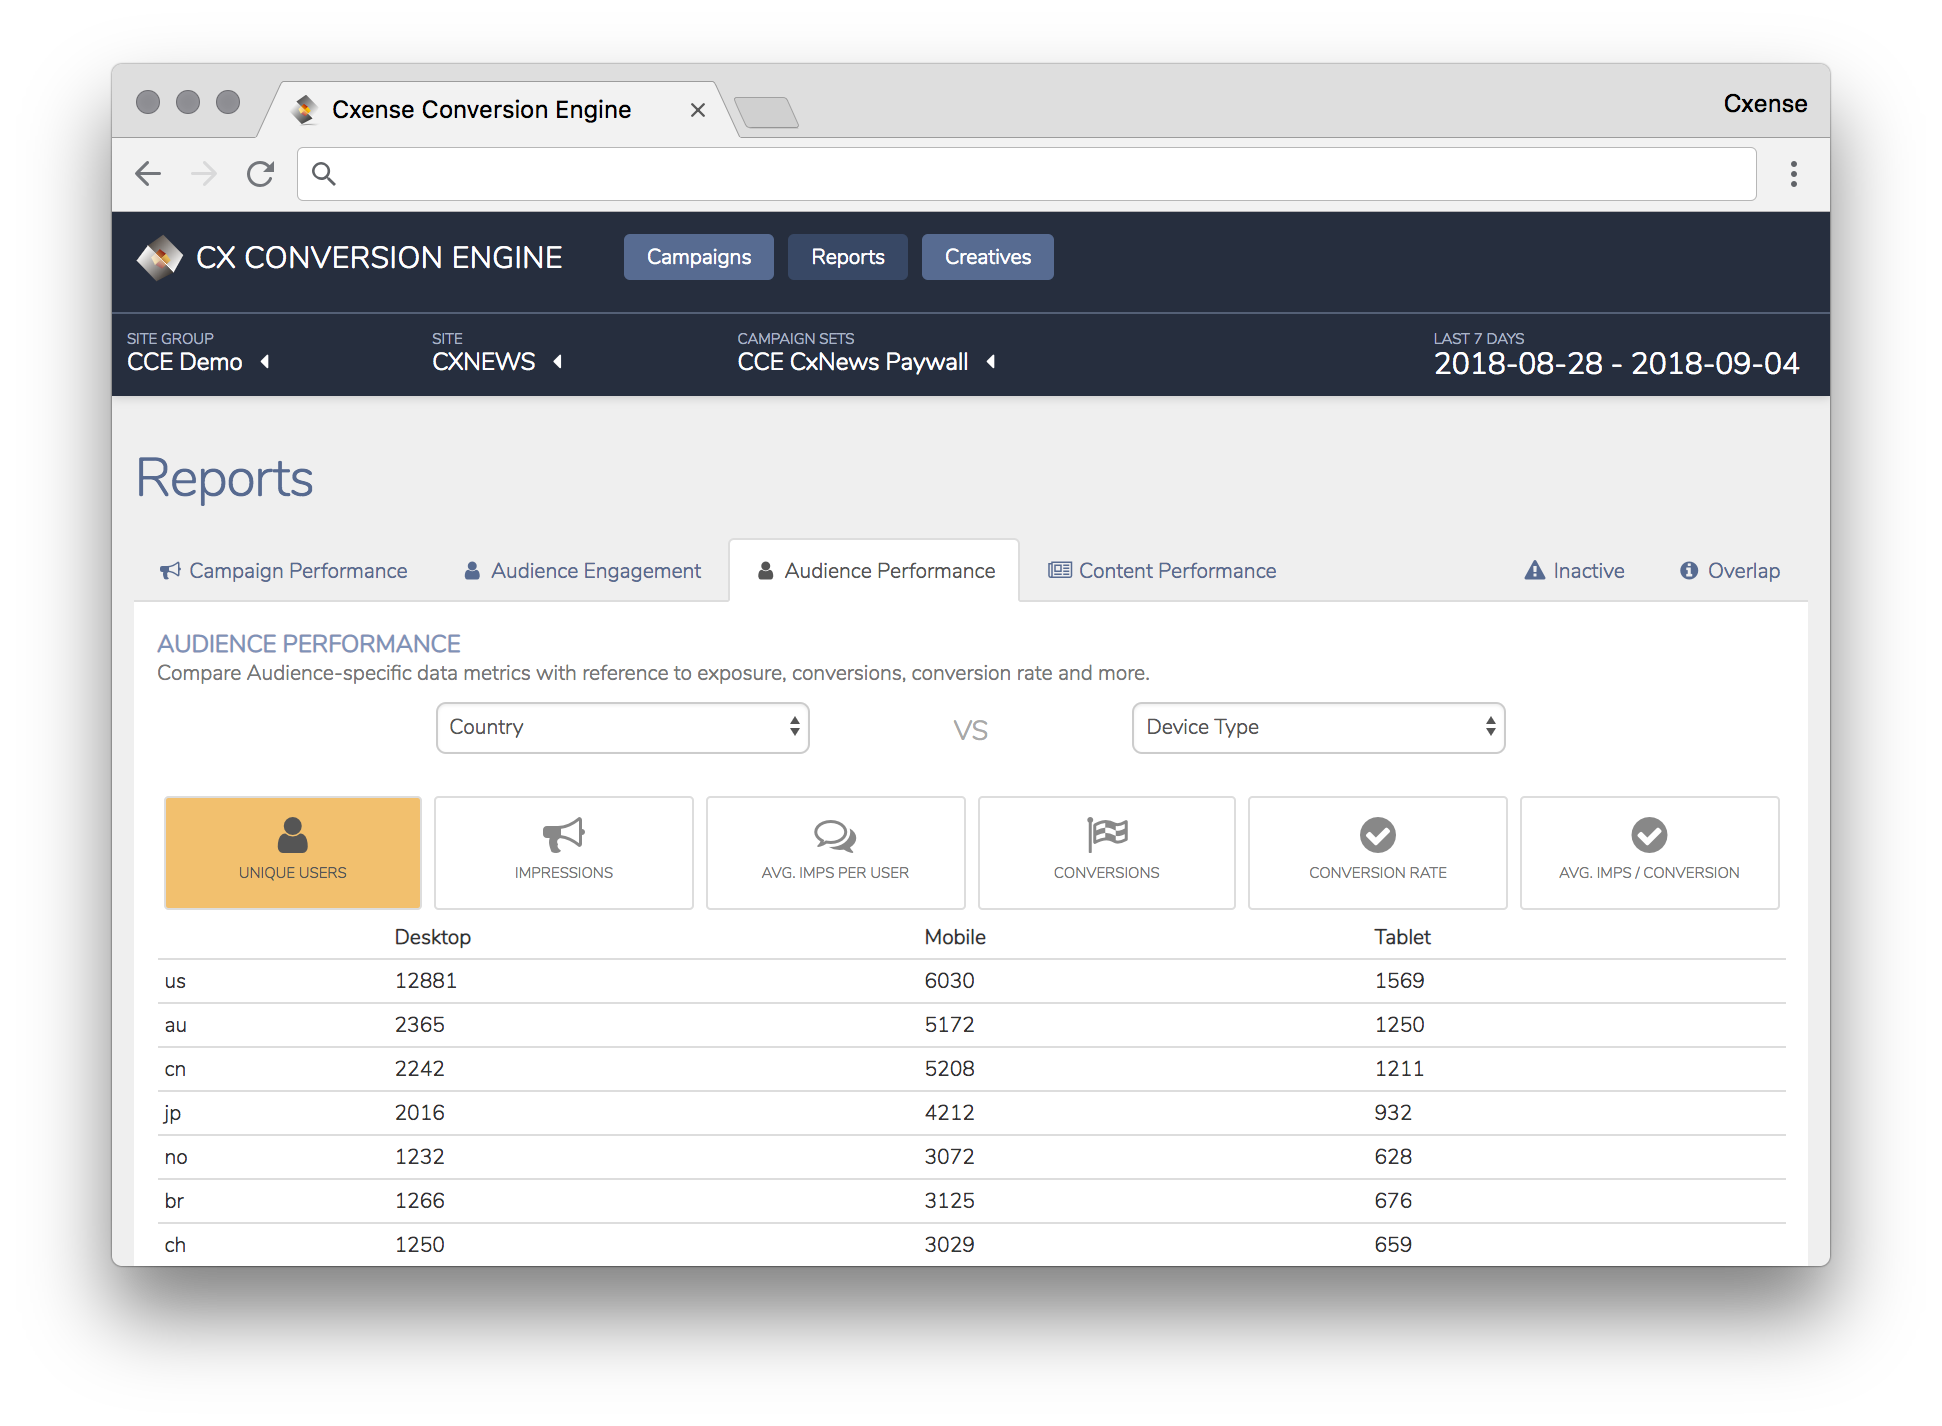
The Audience Performance Report provides the opportunity to explore attributes associated with the different real-time results. Select a result metric then select two dimensions to compare attributes to better understand how the results are associated with these attributes. E.g. select Users split by Country and Device Type; this provides you a matrix with the number of users that exposed to the campaigns per country per device. In the picture below the number of users on your site from the U.S. on Desktop is 12881. The table gets updated automatically upon changing the any of the result metric or any of the parameters:
Content Performance Report
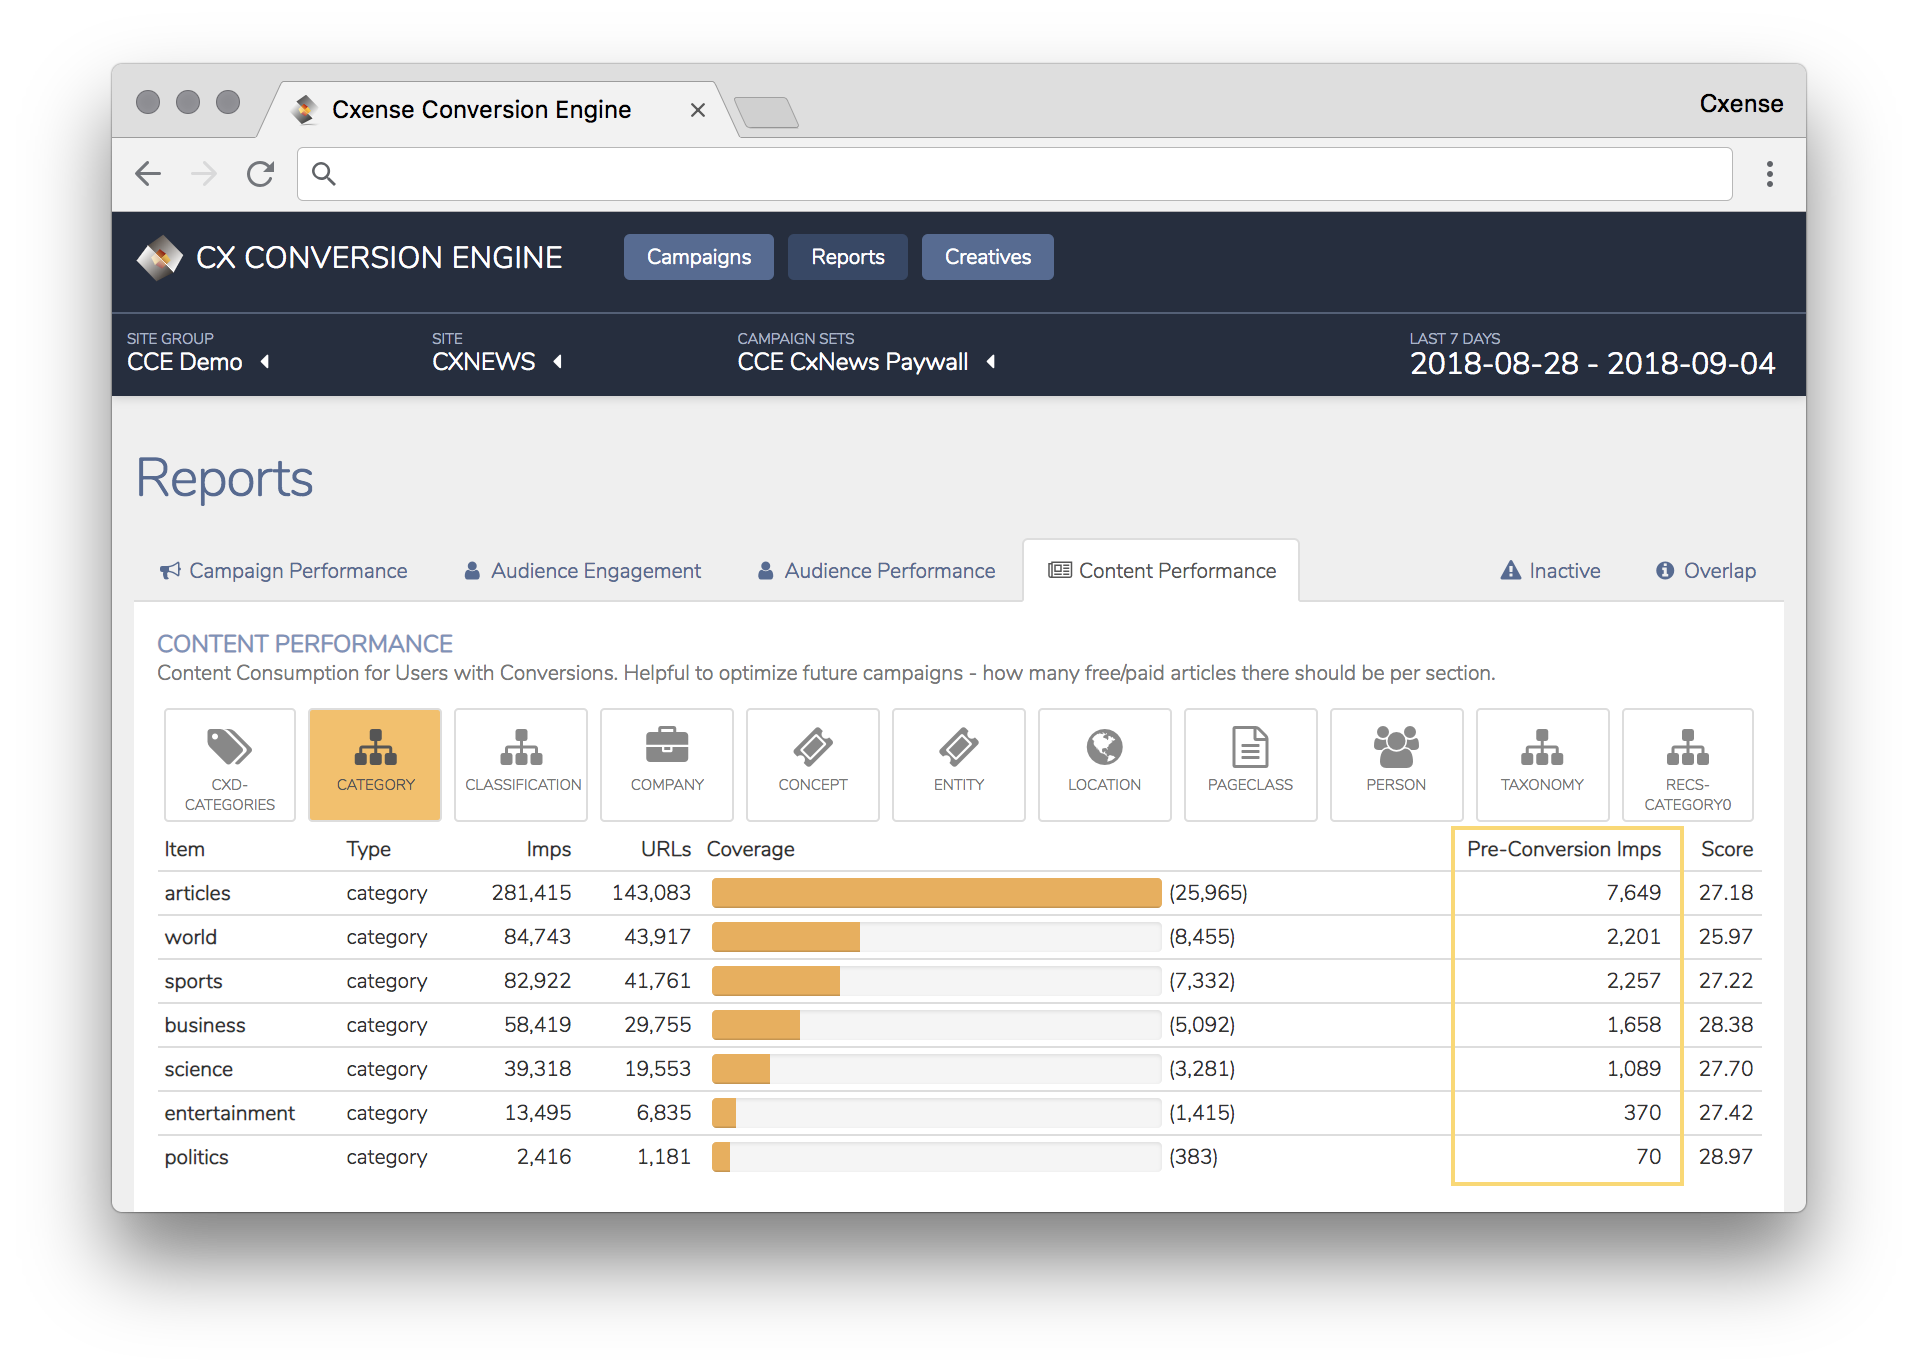
The Content Performance Report provides you insight about your how your content has performed for the selected time period. You can filter on the available dimensions you want to explore by select and unselect the dimensions on the top of the table e.g. Category, Classification, etc.
The metrics shown in the table are Item, Type, Impressions, URLs, Coverage, Pre-Conversion Impressions, and a content Score.
-
Item = The categories available in the filter selected
-
Type = The filters selected in the top row
-
Impressions = Number of impressions the content has generated
-
URLs = Unique URLs published containing the item in question
-
Coverage = Percentage of all articles published containing the item in question
-
Pre-Conversion Impressions = Number of impressions the converted users generated before they converted within the category
-
Score = Content score that indicates how popular the content items were among the users who tried to convert or converted
While the Impressions, Unique URLs and Coverage figures give you the general overview of how popular the content is across the site, the column "Pre-Conversion Imps" and "Score" represents the count of impressions the user consumed before making a conversion. Higher numbers in this column indicate that the section is more popular for a converting audience during their conversion session - this information can be valuable for planning future campaigns and deciding what proportion between free/paid content to use.
Product Performance Report
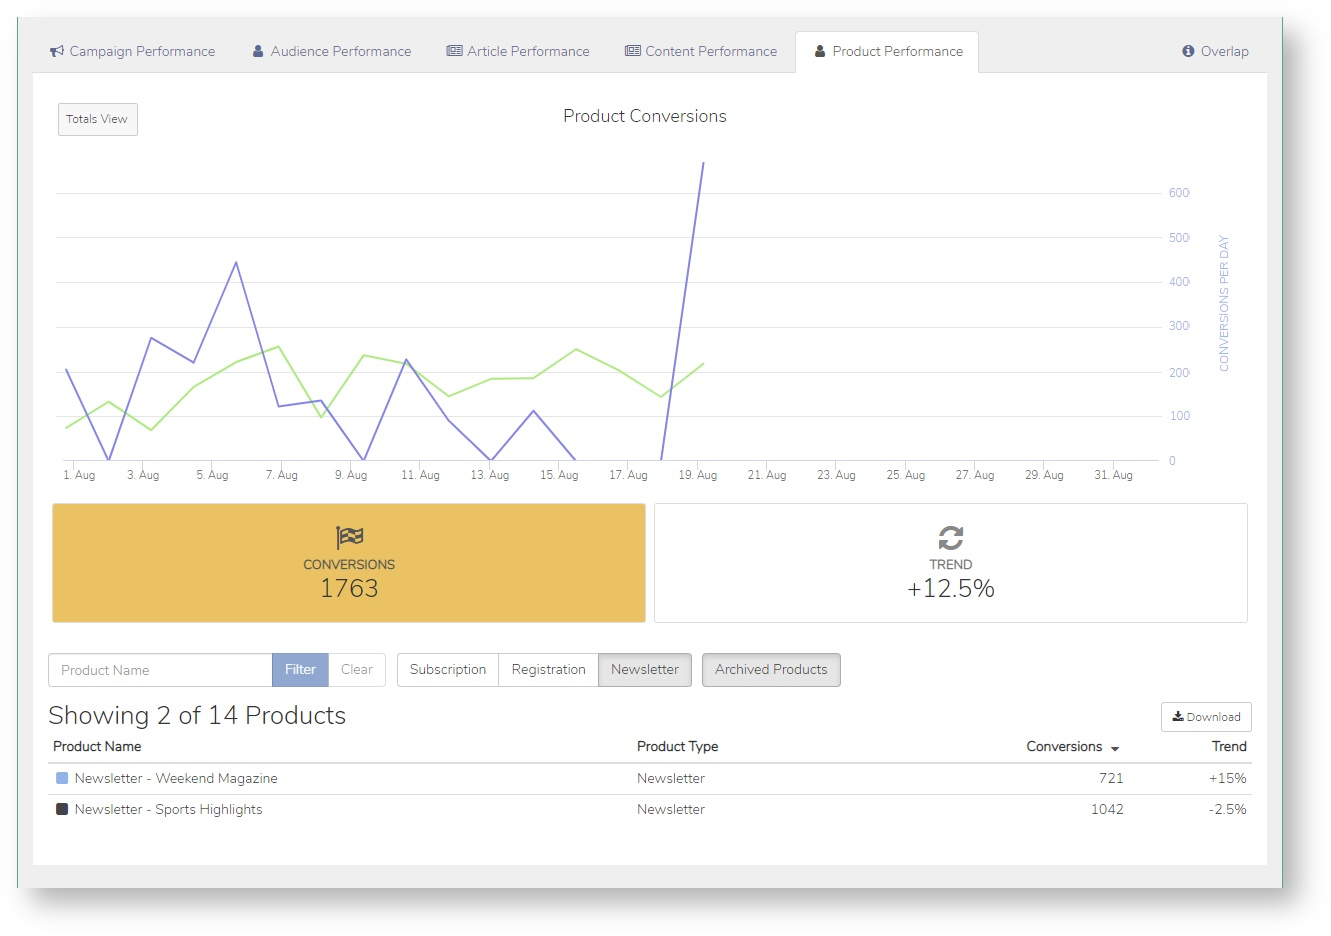
The Product Performance Report provides the performance results for products defined for your site. If you have instrumented Product Conversion Tracking, you can track conversions per-product basis:
|
"Trend" shows a comparison between the currently selected period and the previous period of the same length. For example, if you are looking at the data from yesterday, "Trend" shows the comparison with the day before yesterday. |
|
Note the difference in conversion numbers between the Campaign Performance Report and the Product Performance Report:
|
Troubleshooting Tools
The Reports section of the CCE also offers the tools to identify the potential issues with the selected Campaign Set.
Inactive Campaigns
Depending on the general setup, targeting criteria and the order of campaigns within a Campaign Set, some of the campaigns may get no impressions because they are inactive e.g. due to the selected schedule. To get an overview of these campaigns you can see these on the Inactive tab:
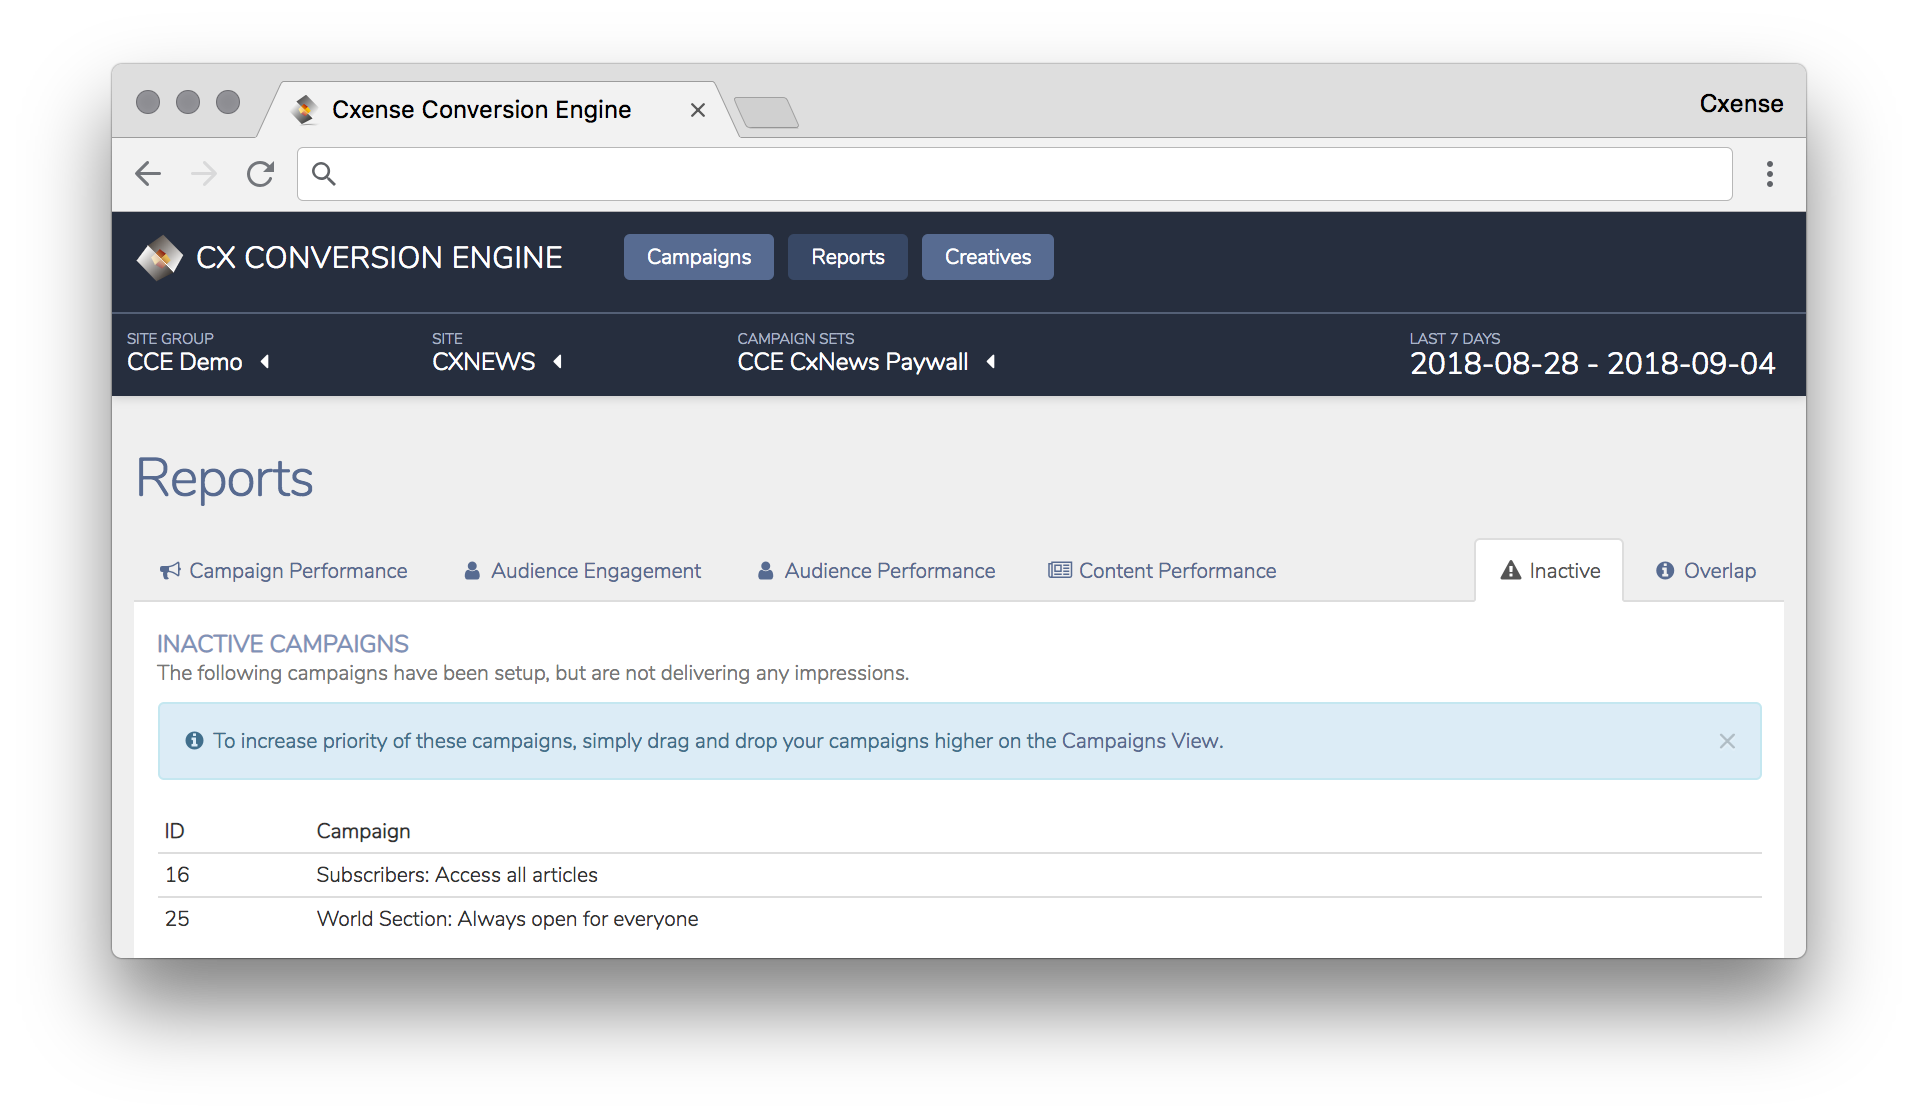
Inactive campaigns can also be observed having a grey circle next to it in the Campaign Set overview page.
Overlap Report
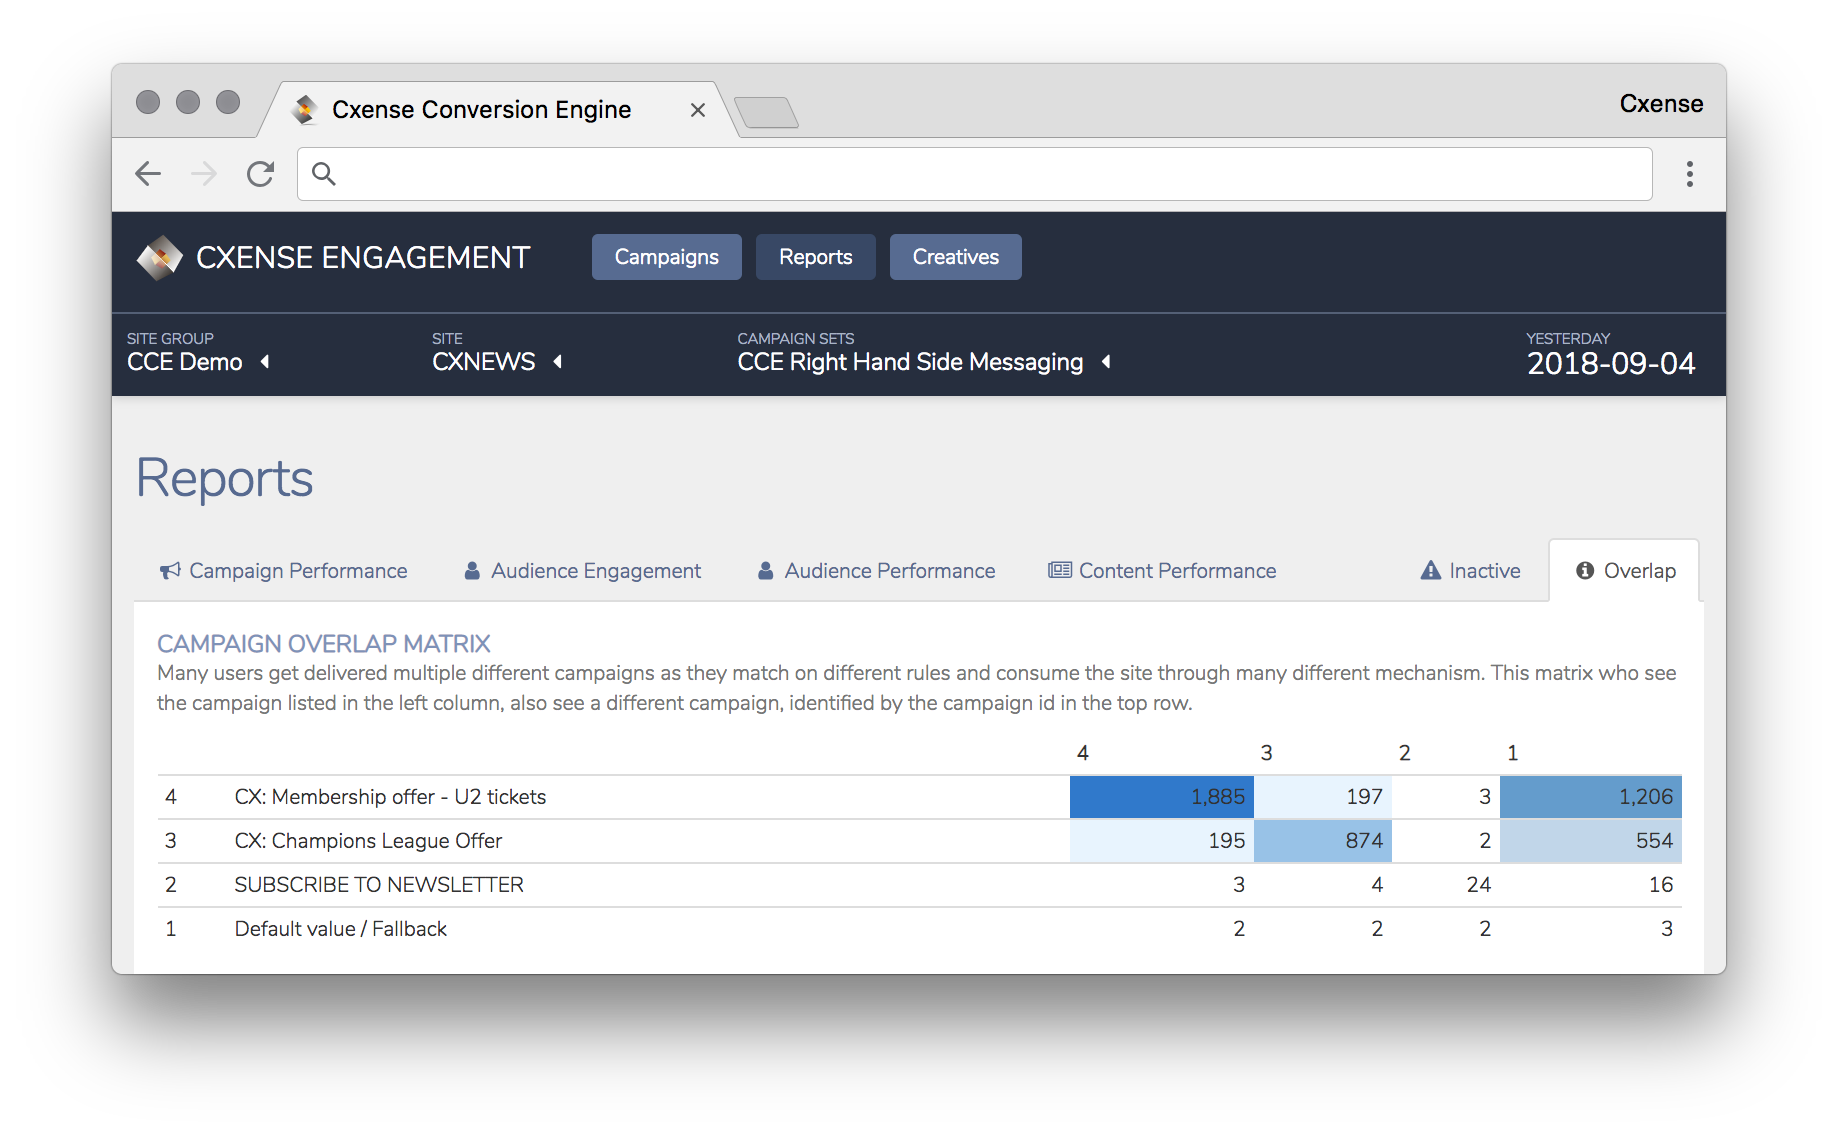
This tool will enable you to identify the campaigns that have an overlapping audience, i.e. the users who equally match the targeting criteria of two or more campaigns you have created. This tool can be useful to verify that you have not created a set of campaigns that target the same part of your audience and that the remaining part is left being exposed to no experiences.