We’ve migrated our documentation to a new site, which means some URLs have changed.
Analytics

Social Insights Boards

Introduction to Social Insights Boards

Introduction

Social Insights provides one standard reporting board to meet the analysis needs of your social publishing team. If you are also a Piano Analytics customer, as detailed below, a version of each board can be saved, manipulated and modified to suit your needs.

image-20260615-100044.png


More information on how to use workspaces can be found here.

Location

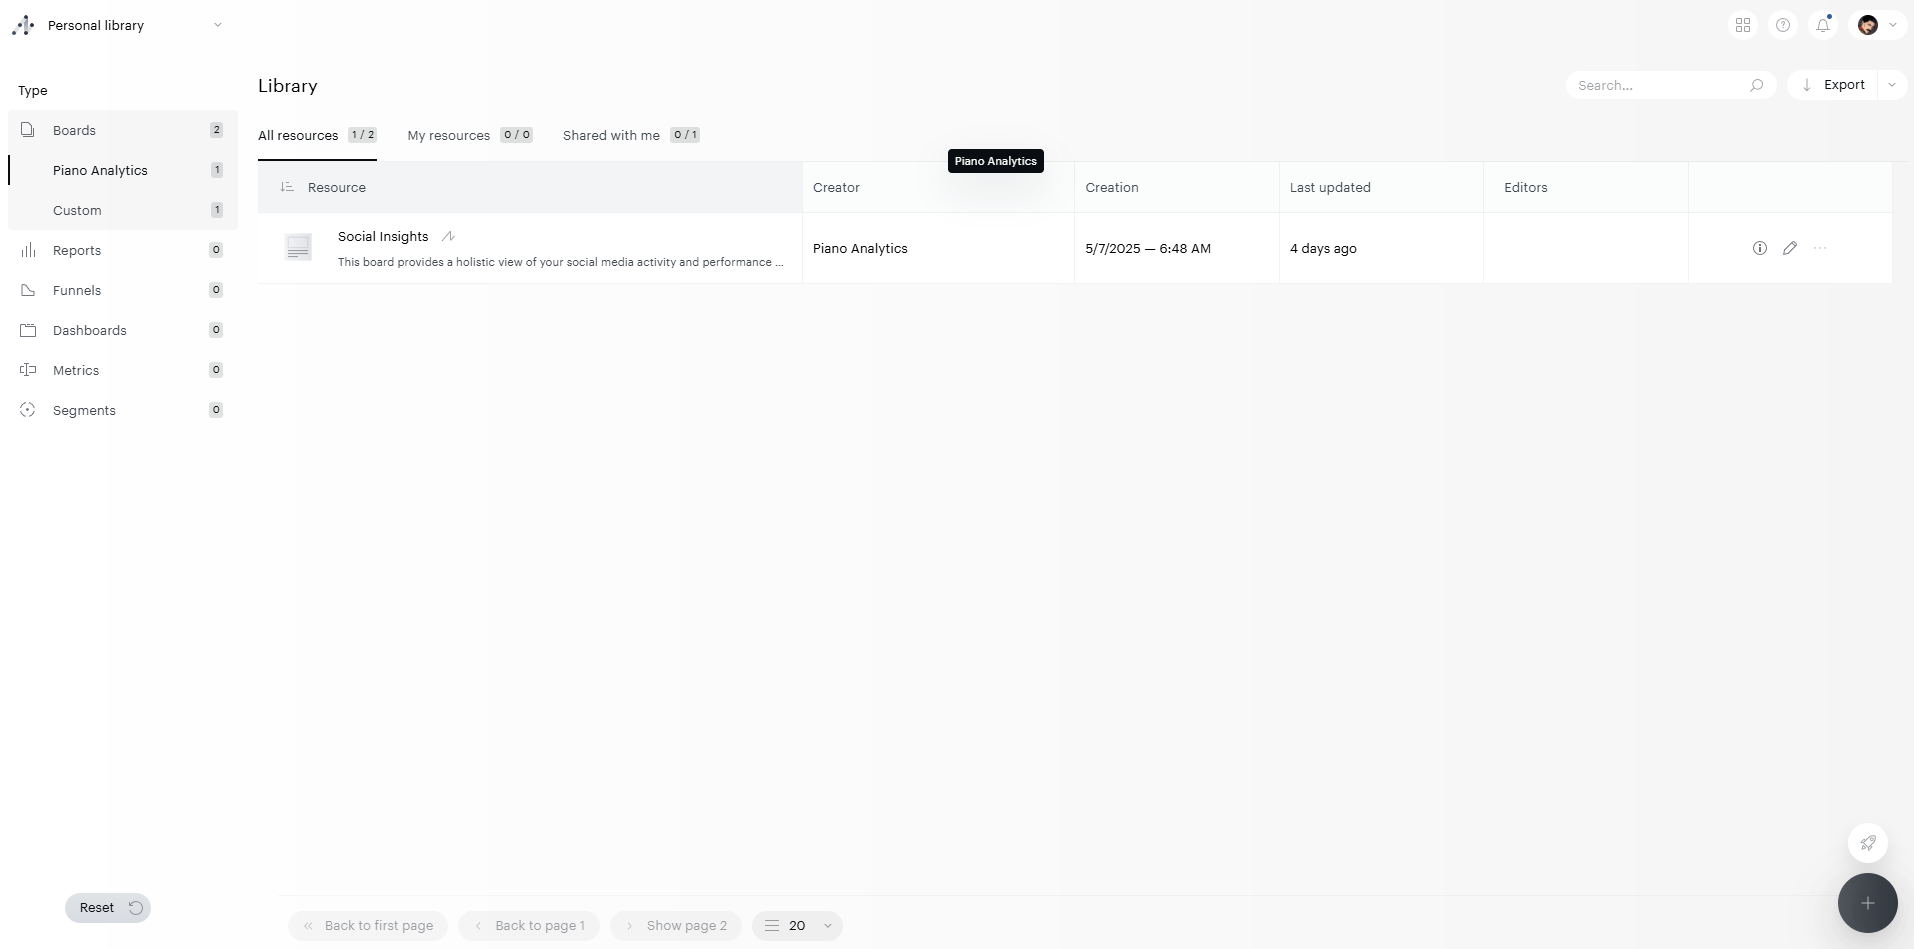
The standard Social Insights board is available in your Piano Analytics library alongside all of your other Piano Analytics resources. All boards are located in Boards > Piano Analytics > All Resources section of your library.

library.PNG

Table of contents

Social Insights

This board provides a complete overview of your social media activity across all platforms. It is divided into 4 tabs - Overview, Publishing, Facebook & X (Twitter) - to help teams track engagement metrics, evaluate publishing strategies, and identify top-performing content, authors, and networks. The goal is to offer actionable insights into what drives performance and how to optimize your social publishing tactics accordingly.

Overview tab

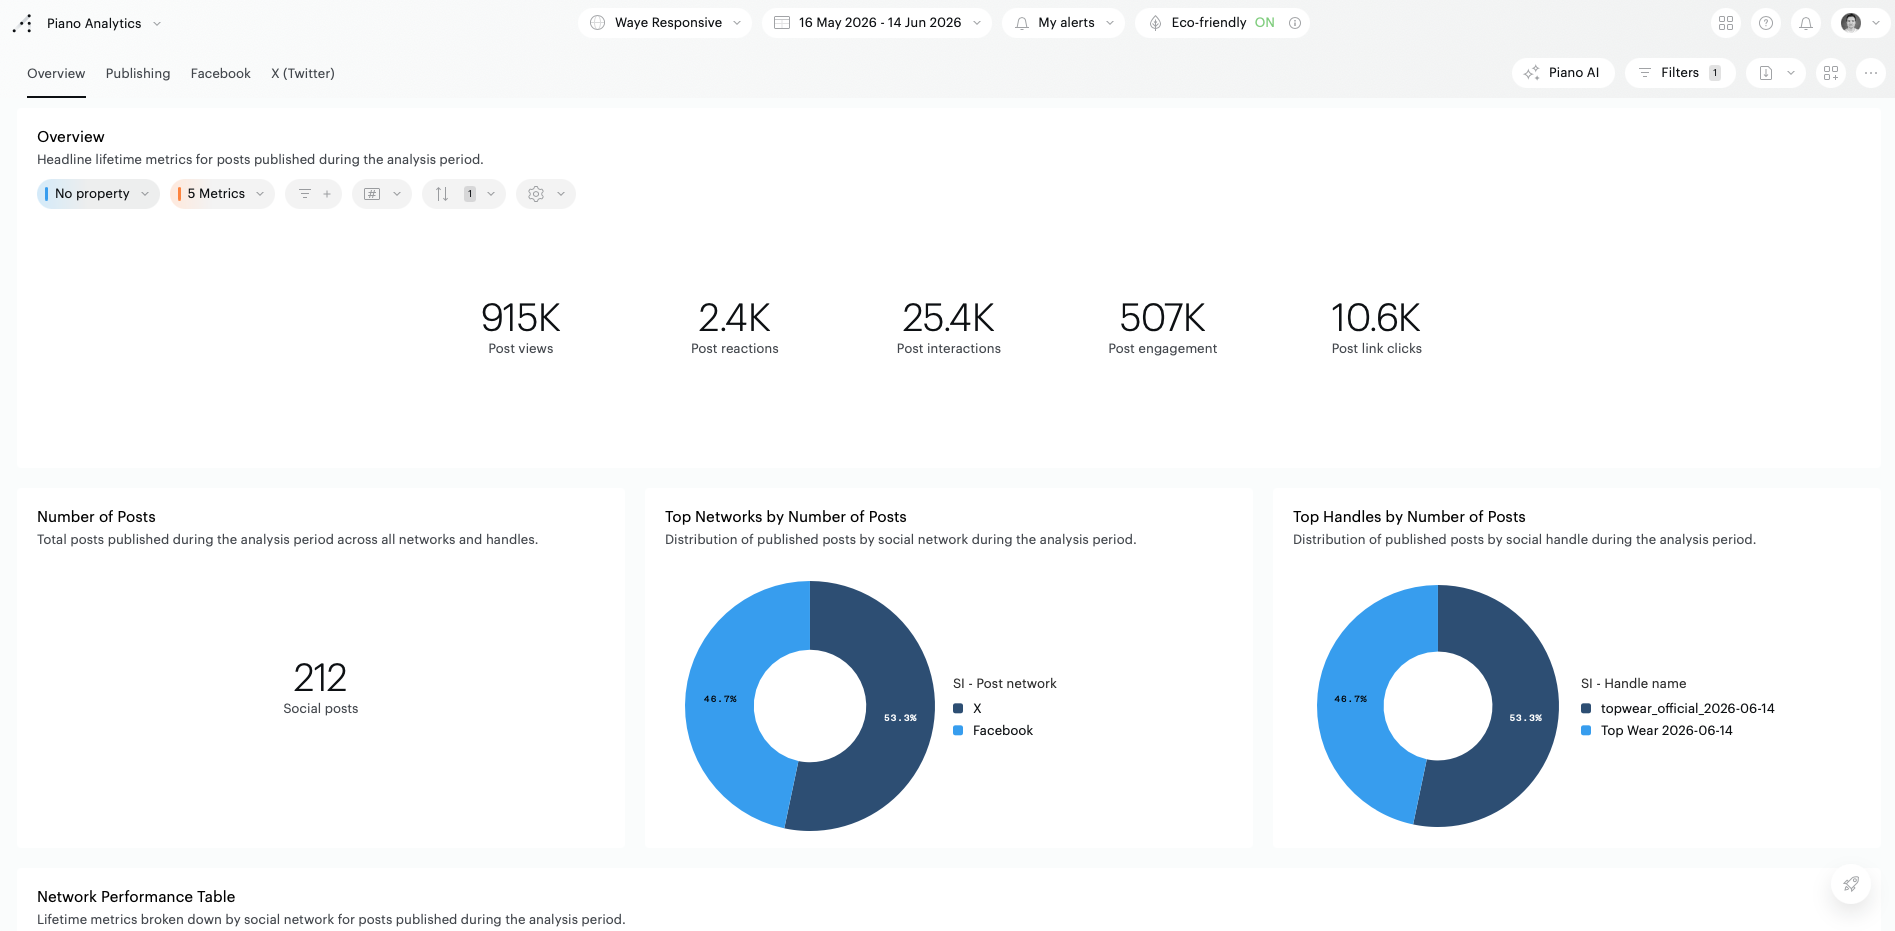
This tab provides a cross-network summary of your social media performance during the selected analysis period. It combines headline reach and engagement metrics with breakdowns by network and handle, helping you quickly identify which platforms and accounts are driving the most views, interactions, and engagement before drilling into more granular detail.

The overview tab contains the following tiles :

Overview

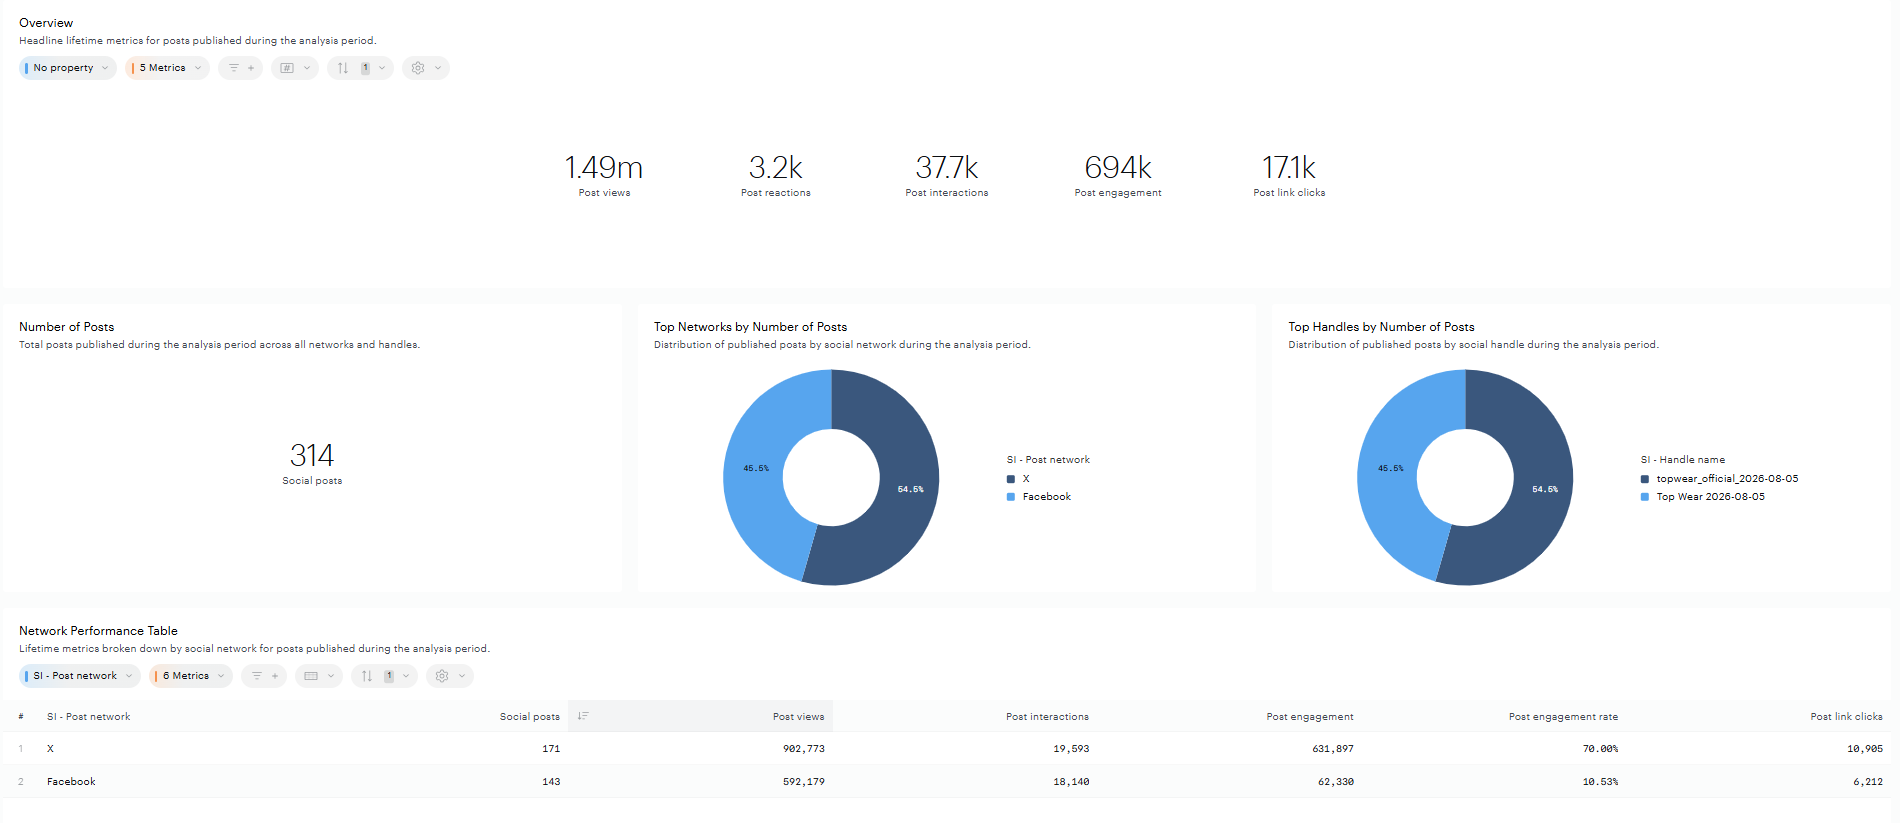
Headline lifetime metrics for posts published during the analysis period. This tile summarizes the overall reach and engagement generated by your social publishing activity, combining post views, post reactions, post interactions, post engagement, and post link clicks into a single high-level snapshot. Use it as your starting point before drilling into individual networks, handles, or posts.

Capture d’écran 2026-07-06 à 17.17.14.png


Number of posts

Total posts published during the analysis period, across all networks and handles. This metric gives a quick read on publishing volume and cadence, helping you understand how much content was produced before looking at how it performed.

Capture d’écran 2026-07-06 à 17.20.08.png

Top Networks by Number of Posts

Distribution of published posts by social network during the analysis period. This chart shows the relative share of your publishing activity across each connected network. Making it easy to see whether your content strategy is balanced or concentrated on one platform.

image-20260706-152131.png


Top Handles by Number of Posts

Distribution of published posts by social handle during the analysis period. This chart breaks down publishing volume by individual handle, helping you identify which accounts are the most active contributors and compare publishing effort across teams or brands.

image-20260706-152347.png


Network Performance Table

Lifetime metrics broken down by social network for posts published during the analysis period. This table places each connected network side by side, across six metrics: social posts, post views, post interactions, post engagement, post engagement rate, and post link clicks, giving a direct, at-a-glance comparison of volume and performance between platforms.

Capture d’écran 2026-07-06 à 17.25.09.png


Top 5 Handles by Post Views

Handles generating the most post views during the analysis period. This chart ranks your top 5 performing handles by reach, making it easy to spot which accounts are driving the most visibility for your content.

Capture d’écran 2026-07-06 à 17.26.43.png


KPIs for Top 5 Handles

Engagement rate for your top-performing handles during the analysis period. Shown alongside the views ranking above, this tile reveals how each top handle's engagement rate compares, helping you distinguish handles that generate views from those that also drive meaningful interaction.

Capture d’écran 2026-07-06 à 17.27.11.png


Top 10 Posts by Post Views

Your most-viewed individual posts published during the analysis period. This ranking surfaces the specific pieces of content that resonated most with audiences, useful for identifying formats or topics worth repeating.

Capture d’écran 2026-07-06 à 17.27.47.png


KPIs for Top 10 Posts

Engagement rate for your most-viewed posts published during the analysis period. Paired with the views ranking, this tile shows whether your top-viewed posts are also driving strong engagement, or whether reach and engagement are diverging.

Capture d’écran 2026-07-06 à 17.28.16.png


Publishing Tab

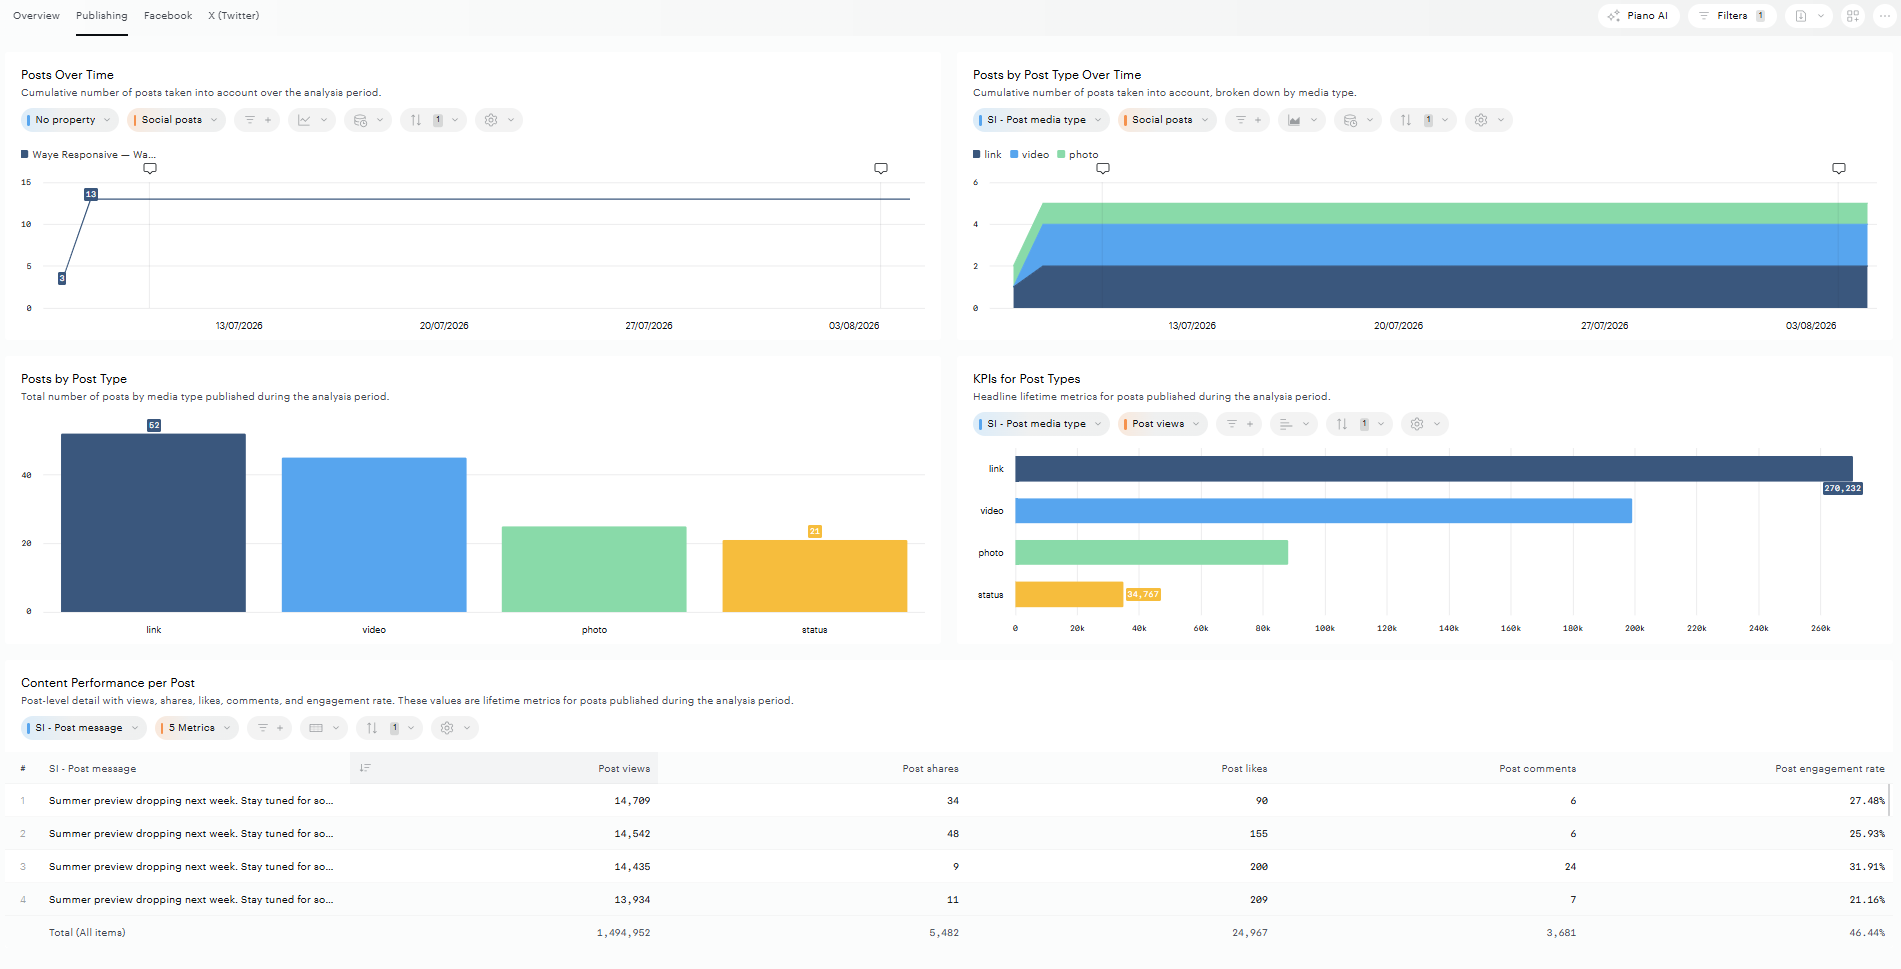
This tab focuses on your publishing activity rather than performance alone, showing how much content you published, in what format, and how each individual post performed. It's built to help content teams understand publishing cadence and format mix, and to pinpoint which posts and content types are resonating most with your audience.

This tab contains the following tiles :

Posts Over Time

Cumulative number of posts taken into account over the analysis period. This line chart tracks how publishing volume builds up day by day, helping you spot bursts of activity or gaps in your posting cadence throughout the period.

Capture d’écran 2026-07-06 à 17.31.47.png

Posts by Post Type Over Time

Cumulative number of posts taken into account, broken down by media type. This stacked area chart shows how the mix of content formats, such as link, video, and photo, evolves over the analysis period, revealing shifts in publishing strategy over time.

Capture d’écran 2026-07-06 à 17.32.09.png

Posts by Post Type

Total number of posts by media type published during the analysis period. This chart compares publishing volume across formats (link, video, photo, status), showing which content types your team relies on most.

Capture d’écran 2026-07-06 à 17.32.52.png

KPIs for Post Types

Headline lifetime metrics for posts published during the analysis period, broken down by media type. This chart ranks post types by a selected metric, such as post views, so you can see which formats are generating the most reach or performance.

Capture d’écran 2026-07-06 à 17.33.32.png

Content Performance per Post

Post-level detail with views, shares, likes, comments, and engagement rate. These values are lifetime metrics for posts published during the analysis period. This table lists every individual post alongside its full performance breakdown, enabling post-by-post analysis to identify standout content and patterns in what drives engagement.

Capture d’écran 2026-07-06 à 17.34.08.png

Facebook Tab

This tab drills into your Facebook publishing and performance specifically, breaking headline reach and engagement metrics down by reaction, interaction, and engagement type, alongside trends over time and post-level video detail. It's designed for teams who want to evaluate Facebook as its own channel rather than as part of a cross-network view.

This tab contains the following tiles :

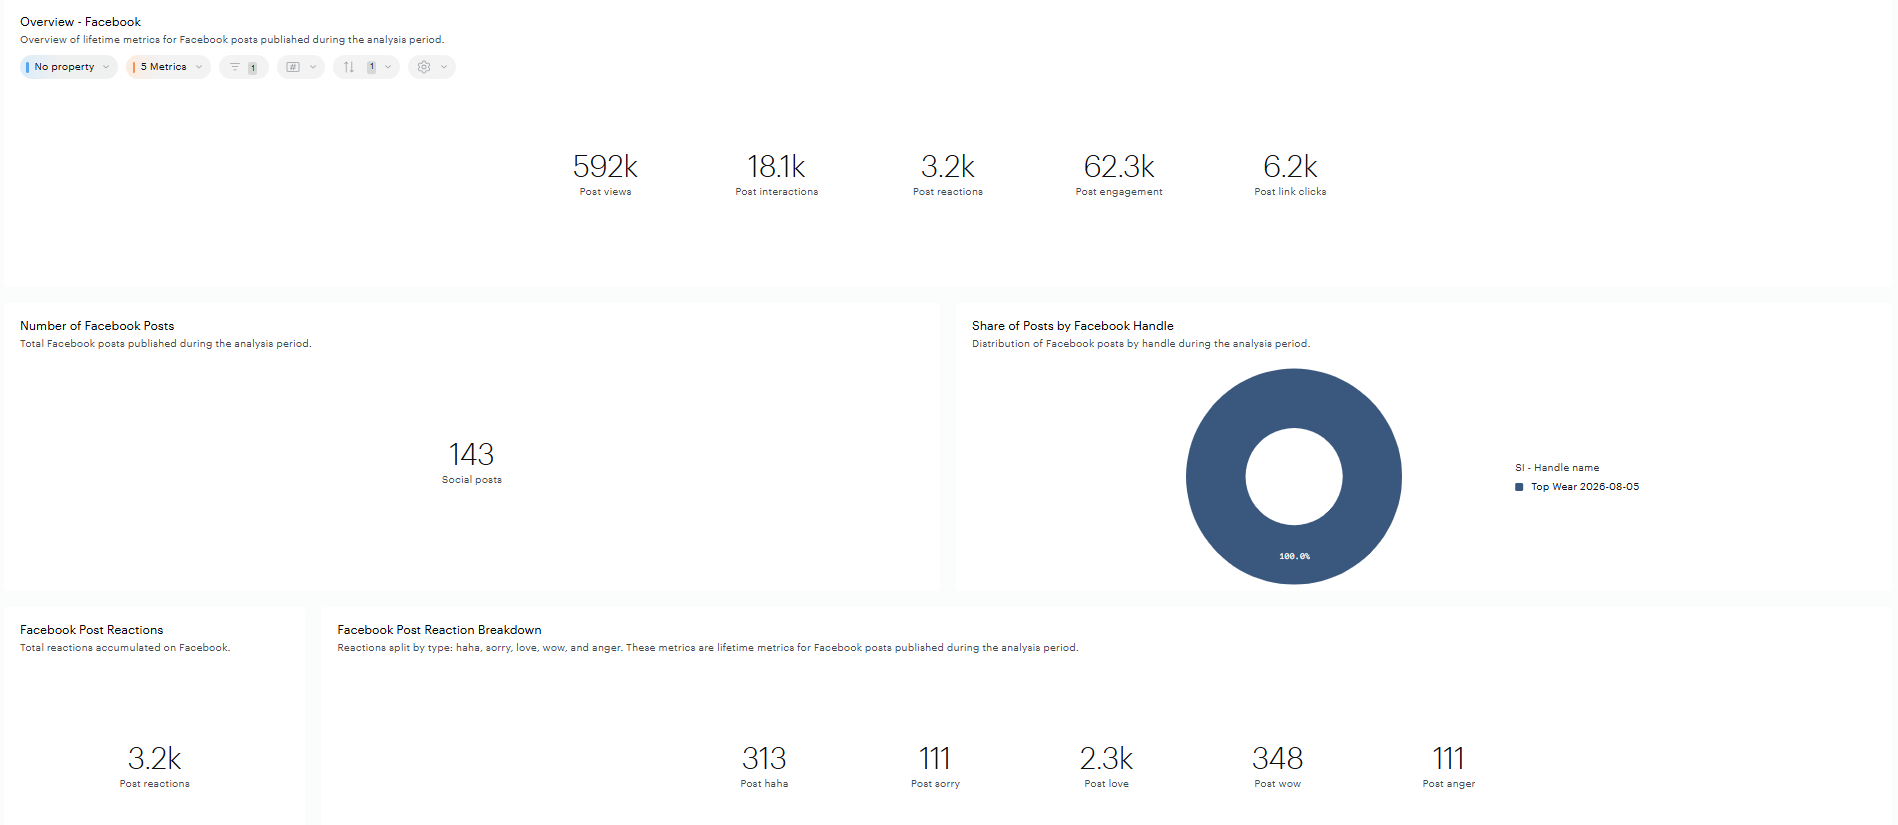
Overview - Facebook

Overview of lifetime metrics for Facebook posts published during the analysis period. This tile mirrors the cross-network Overview tile but narrows the same five headline metrics, post views, post interactions, post reactions, post engagement, and post link clicks, to Facebook only, giving a quick baseline before exploring the network-specific detail below.

Capture d’écran 2026-07-06 à 17.38.11.png

Number of Facebook Posts

Total Facebook posts published during the analysis period. This metric tracks publishing volume specifically on Facebook, useful for comparing output against other networks or against previous periods.

Capture d’écran 2026-07-06 à 17.38.35.png

Share of Posts by Facebook Handle

Distribution of Facebook posts by handle during the analysis period. This chart shows how publishing activity on Facebook splits across your connected handles, helping you see whether one account is carrying most of the publishing load.

Capture d’écran 2026-07-06 à 17.38.51.png

Facebook Post Reactions

Total reactions accumulated on Facebook. This is the headline reaction count for all Facebook posts published in the period, anchoring the reaction breakdown and trend tiles that follow.

Capture d’écran 2026-07-06 à 17.39.13.png

Facebook Post Reaction Breakdown

Reactions split by type: haha, sorry, love, wow, and anger. These metrics are lifetime metrics for Facebook posts published during the analysis period. This breakdown shows which emotional reactions your Facebook content is generating, offering insight into how audiences are responding beyond a simple like or share.

Capture d’écran 2026-07-06 à 17.39.34.png

Facebook Post Reactions Over Time

Cumulative post reactions over the analysis period. This line chart tracks how reactions build up day by day, making it easy to spot spikes tied to specific posts or campaigns.

Capture d’écran 2026-07-06 à 17.40.12.png

Facebook Post Interactions

Total interactions accumulated on Facebook. This headline figure combines all forms of interaction, reactions, likes, shares, and comments, into a single count for the period.

Capture d’écran 2026-07-06 à 17.40.27.png

Facebook Post Interaction Breakdown

Interactions split by type: reactions, likes, shares, and comments. This breakdown shows the relative mix of interaction types on Facebook, helping you understand whether audiences are mostly reacting, liking, sharing, or commenting on your content.

Capture d’écran 2026-07-06 à 17.40.43.png

Facebook Post Interactions Over Time

Cumulative post interactions over the analysis period. This chart shows the day-by-day accumulation of interactions, useful for correlating spikes with specific publishing activity.

Capture d’écran 2026-07-06 à 17.41.06.png


Facebook Post Engagement

Total engagement accumulated on Facebook. This is the broadest performance figure for the network, combining interactions, clicks, and video views into a single engagement total.

Capture d’écran 2026-07-06 à 17.41.22.png

Facebook Post Engagement Breakdown

Engagement split by type: interactions, clicks, and video views. This breakdown shows which behaviors are driving overall engagement on Facebook, distinguishing passive interactions from more active behaviors like clicking through or watching video.

Capture d’écran 2026-07-06 à 17.41.40.png

Facebook Post Engagement Over Time

Cumulative post engagement over the analysis period. This chart tracks the day-by-day build-up of total engagement, helping identify which days or campaigns contributed most to overall performance.

Capture d’écran 2026-07-06 à 17.42.05.png

Facebook Video Post Performance

Post-level video metrics: views, playback starts, 3-second plays, 30-second plays, and completions. This table breaks down performance for individual video posts, showing how far into each video viewers watched, useful for evaluating video effectiveness and spotting drop-off points.

Capture d’écran 2026-07-06 à 17.42.21.png


X (Twitter) tab

This tab drills into your X publishing and performance specifically, breaking headline reach and engagement metrics down by interaction and engagement type, alongside trends over time and post-level video detail. It mirrors the Facebook tab's structure, with platform-specific differences such as post saves as an interaction type and percentage-based video play milestones.

This tab contains the following tiles:

X (Twitter) Overview

Overall lifetime metrics for X posts published during the analysis period. This tile mirrors the cross-network Overview tile but narrows the headline metrics, post views, post interactions, post engagement, and post link clicks, to X only, giving a quick baseline before exploring the network-specific detail below.

Capture d’écran 2026-07-06 à 17.50.57.png

Number of X (Twitter) Posts

Total X posts published during the analysis period. This metric tracks publishing volume specifically on X, useful for comparing output against Facebook or against previous periods.

image-20260706-155354.png

Share of X (Twitter) Posts by Handle

Distribution of X posts by handle during the analysis period. This chart shows how publishing activity on X splits across your connected handles, helping you see whether one account is carrying most of the publishing load.

image-20260706-155417.png

X (Twitter) Post Interactions

Total interactions accumulated on X. This headline figure combines all forms of interaction on the platform into a single count for the period.

Capture d’écran 2026-07-06 à 17.54.41.png

X (Twitter) Post Interaction Breakdown

Interactions split by type: likes, shares, comments, and saves. This breakdown shows the relative mix of interaction types on X, helping you understand whether audiences are mostly liking, sharing, commenting, or saving your content. Note that saves is specific to X and doesn't appear in the equivalent Facebook breakdown.

Capture d’écran 2026-07-06 à 17.54.51.png

X (Twitter) Post Interactions Over Time

Maximum post life: 30 days. This line chart tracks the day-by-day accumulation of interactions on X, useful for correlating spikes with specific publishing activity, capped at each post's first 30 days to keep the trend focused on organic performance.

Capture d’écran 2026-07-06 à 17.55.10.png

X (Twitter) Post Engagement

Total engagement accumulated on X posts. This is the broadest performance figure for the network, combining interactions, clicks, and video views into a single engagement total.

Capture d’écran 2026-07-06 à 17.55.26.png

X (Twitter) Post Engagement Breakdown

Engagement split by type: interactions, clicks, and video views. This breakdown shows which behaviors are driving overall engagement on X, distinguishing passive interactions from more active behaviors like clicking through or watching video.

Capture d’écran 2026-07-06 à 17.55.42.png

X (Twitter) Post Engagement Over Time

Cumulative post engagement over the analysis period. This chart tracks the day-by-day build-up of total engagement on X, helping identify which days or campaigns contributed most to overall performance.

Capture d’écran 2026-07-06 à 17.56.05.png

X (Twitter) Video Post Performance

Post-level video metrics: views, playback starts, 25%/50%/75% plays, and completions. This table breaks down performance for individual video posts on X, showing how far into each video viewers watched using percentage-based milestones. Note X uses percentage thresholds (25%, 50%, 75%) rather than the time-based thresholds (3s, 30s) used on Facebook.

Capture d’écran 2026-07-06 à 17.56.20.png


Last updated: