
How to Access
There are three ways to access the A/B test report:
Composer experience card
The first method to reach the A/B test report is to select the option from the Reports dropdown on the card for an experience that contains an A/B test.
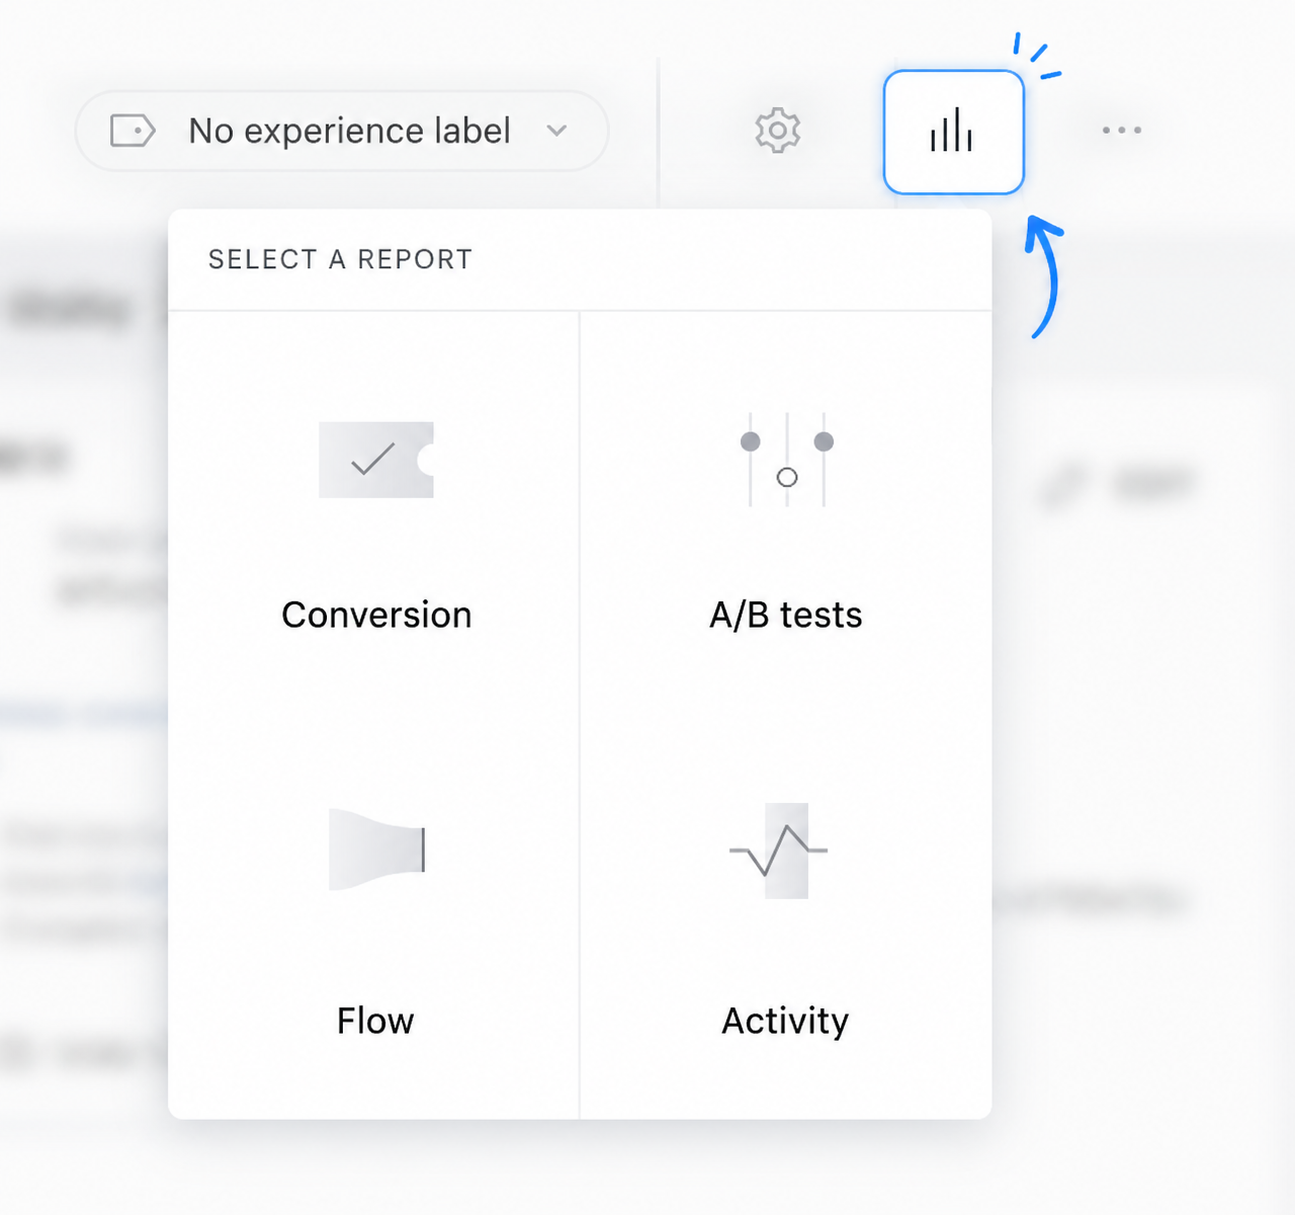
You will be brought to the A/B test overview, which presents you with all active A/B tests running on that experience.

From this view, simply click on the A/B test that you would like more information on to view the full report.
Composer canvas
Similarly, you can navigate to the report from the Composer canvas by clicking on the Reports icon in the dropdown at the top left and selecting A/B tests.
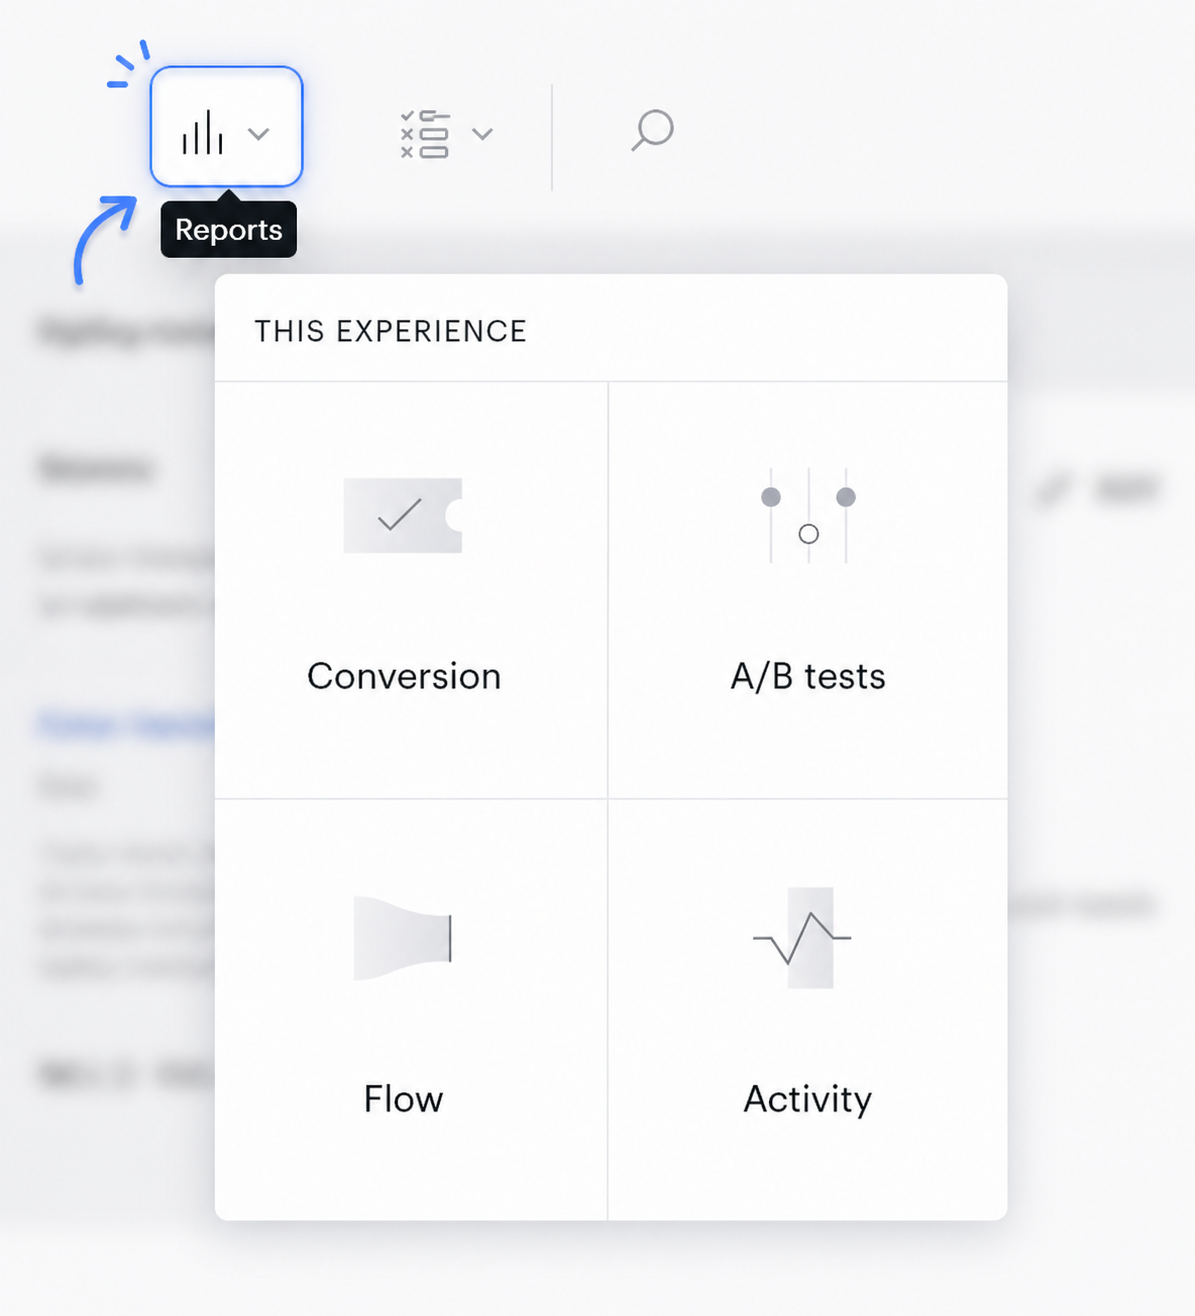
Then, select the test you would like to view the report for.
A/B test card
You can also access the report for an A/B test from within the A/B test card itself. To do this, locate and click on the pencil icon on the A/B test card within your Composer canvas for that Experience. You will see the following modal view:
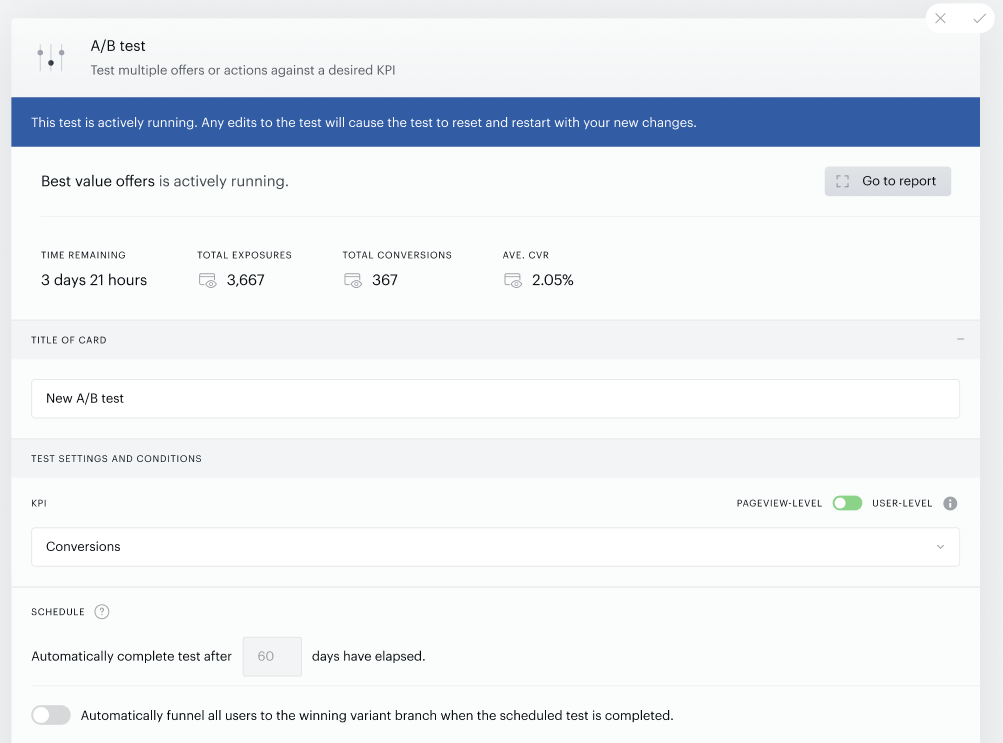
Click on Go to report to view more details.
Note that if you are showing an offer using a Run JS card in our database, which is used for Report composing, any conversions/clicks resulting from such an offer aren't bound to a specific Experience ID, so they won't be shown in the A/B test report.
It is recommended to add the trackingId to the object passed to the tp.offer.show function, for example:
tp.push(['init', function() {
  tp.offer.show({
    offerId: 'OF12345',
    templateId: 'OT67890',
    trackingId: context.trackingId
  });
}]);
This way, the conversions/clicks will be bound to the Run JS card of a specific Experience, so they should appear in the report.
A/B Test Overview
Publishers may occasionally reactivate experiences that were temporarily offline or deactivated for a longer timeframe. It's important to note that our reports are not real-time and do not fetch data for offline experiences. When an experience is reactivated, it may require some time to regenerate all the necessary data to display it accurately.
The A/B test overview presents a summary of each A/B test, both active and completed. You can toggle back and forth between the Active and Deactivated tabs to view reports of ended A/B tests.
The A/B test overview displays the following information:
-
Name of the A/B test and the selected KPI
-
Number of variants and the names you gave them
-
Start date
-
End date
-
Unique users
-
Test status:
-
Test not started yet: The A/B test has been created but has not yet been executed
-
Running: The A/B test is ongoing
-
Ready to conclude test: The A/B test is ready to conclude
-
Not ready to conclude test: The A/B test needs more data to conclude
-
Deactivated: The A/B Test has been archived
-
Running overtime: The A/B test is running longer than its defined duration (for example if you'd like to gather more data due to seasonal fluctuations)
-
Backend error: There is an issue with the Experience setup
-
-
Probability to be best, based on data collected so far, along with the winning variant name for the chosen KPI.
Main Chart
Once you click on the report itself, you will see a large chart that plots the currently selected KPI over the course of the elapsed time of the A/B test for each branch.
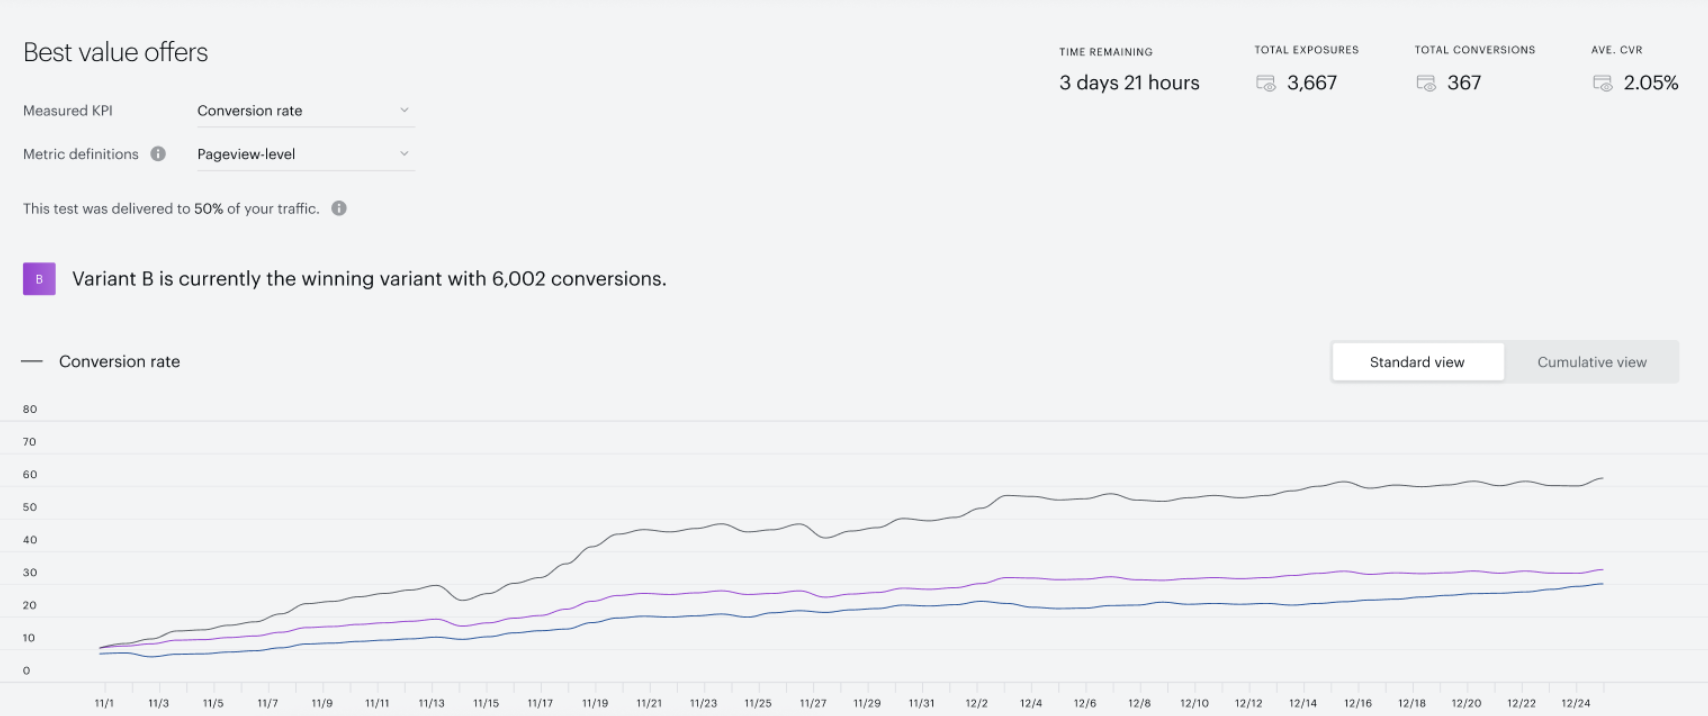
In addition to the chart data, you are shown metrics that reflect holistic data about the A/B test.
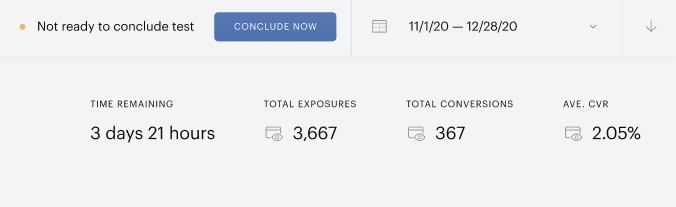
This view will include a Conclude now button, which concludes the A/B test if enough time has elapsed and KPI data has been collected.
Data subsets and filtering
By default, you will be shown data about the measured KPI selected in the A/B test. You can change the KPI plotted by clicking on the dropdown below the A/B test title.
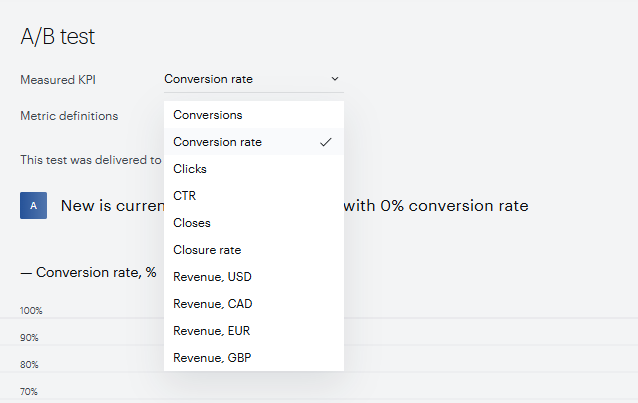
The definitions for each of these KPIs are presented in the table below:
|
KPI |
Definition |
|
Exposures |
The number of times an A/B test variant's branch has resulted in a visible action being presented to the user. |
|
Clicks |
The number of exposures which successfully resulted in an external link click or object click that is manually defined by the client in the template settings within the A/B test variant's branch. |
|
CTR |
The click-through rate for exposures which successfully resulted in a click within an A/B test variant's branch. |
|
Closes |
The number of exposures which resulted in a close click on the template assigned to the A/B test variant. |
|
Closure rate |
The closure rate for exposures which resulted in a close click. |
|
Conversion rate |
The conversion rate for exposures within an A/B test variant's branch. |
|
Conversions |
The number of exposures which successfully resulted in a Management + Billing, adblock or external conversion within an A/B test variant's branch. |
|
Revenue |
The monetary value collected during any conversions within the A/B test variant's branch. |
Tabular Data
The table below the chart contains the following, with a designated row for each A/B test variant:
|
Header |
Definition |
|
Weight |
The distribution of audience traffic for the variant, as you defined upon creating the A/B test. |
|
Tested action |
The card or cards being tested in the variant along with their criteria. |
|
Revenue |
The monetary value collected during any conversions within the A/B test variant's branch. |
|
Exposures |
The number of times the A/B test variant's branch has resulted in a visible action presented. |
|
Conversions |
The number of exposures which successfully resulted in a Management + Billing, adblock or external conversion within the A/B test variant's branch. |
|
Conversion rate |
The conversion rate for exposures within the A/B test variant's branch. |
|
Clicks |
The number of exposures which successfully resulted in an external link click or object click that is manually defined by the client in the template settings within the A/B test variant's branch. |
|
CTR |
The click-through rate for exposures which successfully resulted in a click, an external link click, or a manually logged event within an A/B test variant's branch. |
Exporting Data
At any point, while viewing an A/B test report, you can export the table as a CSV. To begin the export, click the icon in the upper-right-hand corner of your screen.
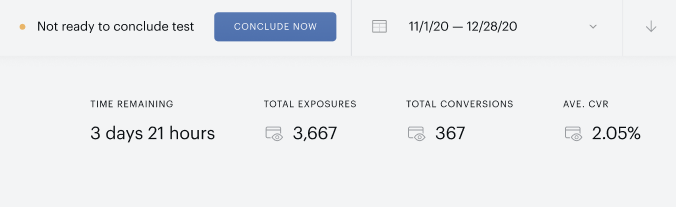
The CSV mimics the contents of the table along with added context related to the experience and A/B test variants.