
Use this article to learn where to find reports for your Composer experiences and what each report can help you understand. You’ll see how to open reports from the experience card or from inside the Composer canvas, review the key metrics available in the Composer Activity and Composer Conversions reports, and learn when to use A/B test, Flow, and C1X Segment summary reports to evaluate experience performance and audience behavior.
Viewing Reports
To access your reports, go to Products→ Composer and select the reports icon in the lower right corner of an Experience card:
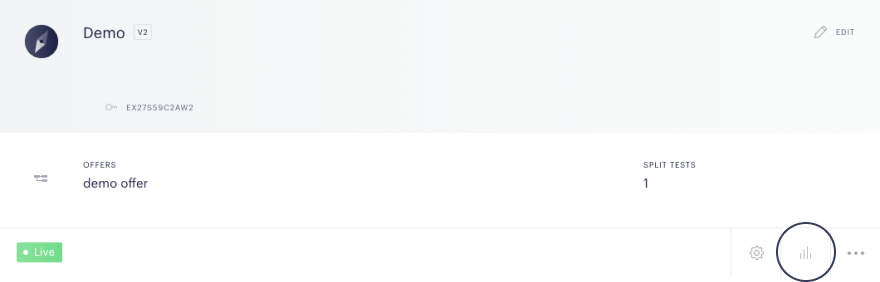
The reports icon appears on every Experience card and can also be accessed from inside each Composer experience from the upper left corner of the canvas.
Important: Composer reports will only function in your production application, not your sandbox application.
Composer Activity Report
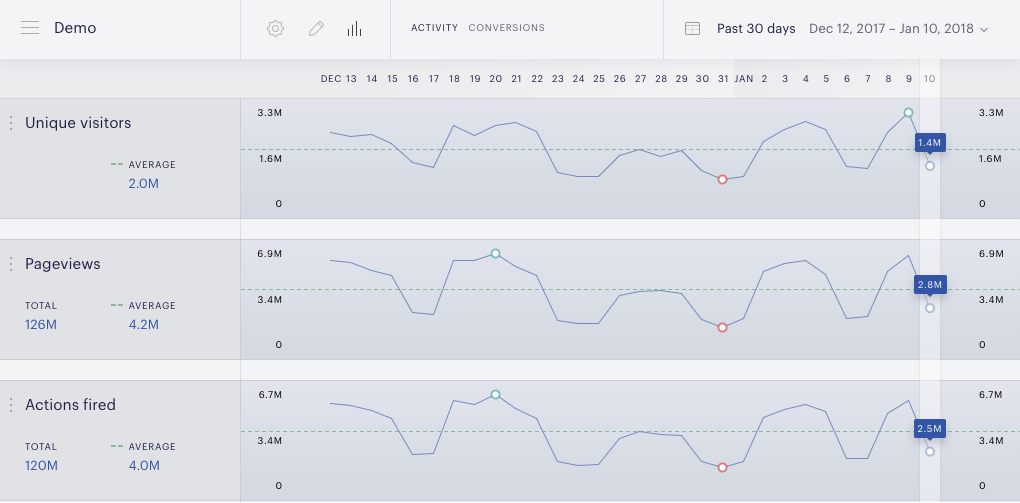
After clicking the reports icon, the first report you will encounter is the Composer Activity Report. You can use the controls at the top to navigate to the Composer Conversions Report or change the timeframe of the report. The activity report is updated every few seconds and includes data on:
Unique visitors: the number of unique visitors who came to your site during the specified time period.
Pageviews: the number of pageviews generated on your site during the specified time period. In many cases, the Pageviews and Executions charts will look similar for a given Experience. However, there are edge cases where pageviews may be recorded without executions.
Executions: the number of times the experience was executed within the Experience card. If the experience was set to live during the entire time period being measured, the number of executions will equal the number of pageviews. Alternatively, if Composer was enabled on your application but you had yet to make an Experience card live, the activity report would show the number of pageviews but no executions.
Actions fired: the number of times a user reached the end of an execution. Below this chart, we show each action that fired, the type of action, and the name of that action, if provided. Please note that actions suppressed as a result of Action exclusivity will not be included here.
There is a deliberate 20-minute delay in event processing due to system latency.
Composer Conversions report
You can access the Composer Conversions report from the reports icon as called out above. The Composer Conversions report provides information on every conversion and conversion type that can occur within your experience. You will be able to find the estimated value that your experience has generated based on editable values assigned to each type of conversion. For more information about the Composer Conversions report, please click here.
A/B test report
The A/B test report outlines the ongoing results of any A/B tests that your experience is running. You can choose the KPI that you would like to measure results by and view data and a visual about the performance of the A/B test branches. Piano also calculates the probability that any given branch will be the winner in near real-time updates. For more information about the A/B test report, please click here.
Flow report
The Flow report depicts the channels through which your on-site traffic journeys for a given experience. In the flow report, you will be able to see how many browsers got through each step of your experience. For example, if you have a metered paywall set up, you will be able to view how many users triggered the paywall as well as how many users are at different points in the pageview meter. Please click here for detailed information on the Flow report.
C1X Segment summary report
This report provides insight into audience distribution for C1X segments over time. By leveraging Piano presets or custom segment combinations, you can gain an at-a-glance understanding of your segments in aggregate as well as broken down by individual segment. Once you have explored the data associated with different segment combinations, you can target your selected segments at the click of a button. More information about this report is available here.