Access the Report
The report can be accessed from four points in the Piano dashboard: 1. Experience manager; 2. Experience reports tab; 3. Composer canvas; 4. User segment card.
Experience manager
-
Navigate to Experience manager by clicking Products > Composer.
-
Click the Segments icon next to the search bar.
-
Click Segments to access the report.
Experience reports tab
-
Navigate to Experience manager by clicking Products > Composer.
-
Click the Reports icon within an Experience tile.
-
Click Segments to access the report.
Composer canvas
-
Navigate to the Composer canvas by clicking Products > Composer. Then click Compose to create a new Experience or click the Edit icon next to any existing Experience.
-
Click the Segments icon next to the search bar.
-
Click Segments to access the report.
User segment card
-
Navigate to the Composer canvas by clicking Products > Composer. Then click Compose to create a new Experience or click the Edit icon next to any existing Experience.
-
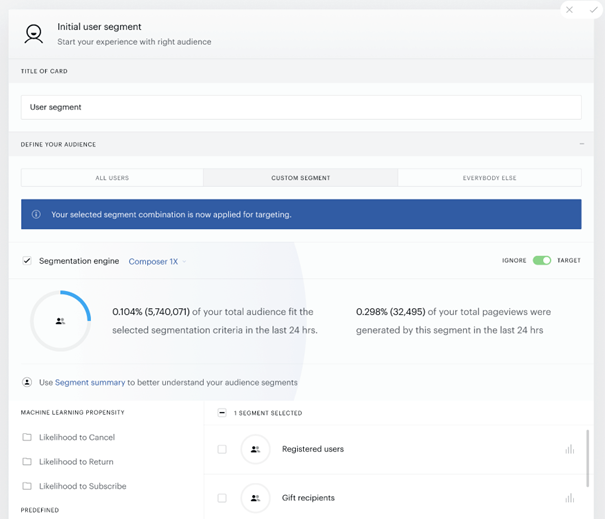
Click the Edit icon on the User segment card to open the card editor.
-
Click Custom segment and select C1X Segmentation engine.
-
Click Segment summary under the audience coverage visualization.
Presets
Piano presets are segment combinations that serve as jumping off points for your exploration and customization within the report.
Composer + Management + Billing presets include:
-
High frequency subscribers: Subscribers + 10+ visit days last month
-
Low recency subscribers: Subscribers + Active last 15+ days
-
All users
Composer-only presets include:
-
High frequency users: All users + 10+ visit days last month
-
Low recency users: All users + Active last 15+ days
-
All users
When first opening the report, the High frequency subscribers preset will be selected by default. You have the option to select a different preset from the preset library.
Modify Timeframe
You have the option to view data by last month, last week or last day. When first opening the report, the Last month timeframe will be selected by default.
Customize Report Interface
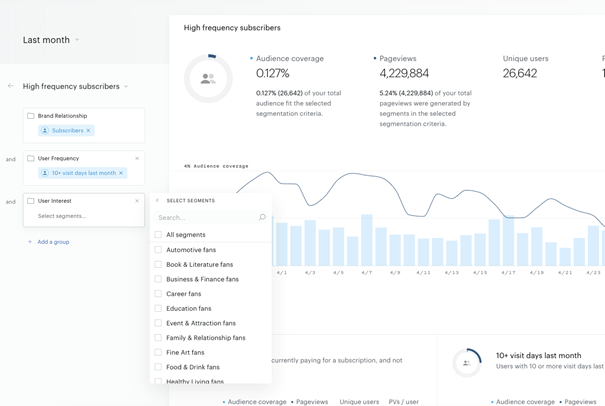
At the top of the interface, you can view a summary of the data associated with the current segment combination. This includes audience coverage, pageviews, unique visitors, and pvs per user. Below the summary graph, you can see a breakdown of each individual segment that is included in the current combination.
You have the option to customize the report interface to your preference. At the top of the report, you can choose to select grid or list view.
-
Grid view: When Grid view is selected, each segment included in the current combination will display as widgets below the summary graph. These widgets will include audience coverage, pageviews, unique visitors, and pvs per user as well as mini visualizations.
-
You can sort and order segments in Grid view by clicking Sorted by default and selecting the desired sorting and ordering criteria.
-
-
List view: When List view is selected, each segment included in the current combination will display including audience coverage, pageviews, unique visitors, and pvs per user with no segment-level visualization.
-
You can sort and order segments in List view by clicking each metric.
-
First click will sort A-Z or highest to lowest
-
Second click will sort Z-A or lowest to highest
-
Third click will reset sort order
-
-
If you'd like to focus on the segments themselves, you can collapse or expand the summary graph by clicking hide summary graph or show summary graph in the top right corner.
Modify Segment Criteria
Once you've selected a preset, you have the option to modify segment criteria to adjust the segment group(s) and segment(s) you would like to include in a custom combination. Clicking Edit criteria will display options to add or remove segment groups as well as add or remove segments within groups.
Please note: Segment groups will be combined via AND logic. Segments within a group are unified via OR logic. Segments within a group cannot be combined via AND logic.
All combination logic will display in a logical syntax statement where you can easily understand the implications of your selection. This statement will adapt to any modifications made to your combination.
Target
If you have accessed the report via the User segment card within an Experience, you have the option to target directly on the segments selected in the report.
Clicking Target in the upper right corner of the report will close the report and auto-populate the selected segments within the User segment card.
Please note: The Target button can only be used if the report has been accessed via the User segment card within an Experience. If the report is accessed outside of the User segment card, the Target button cannot be used.