
How to access
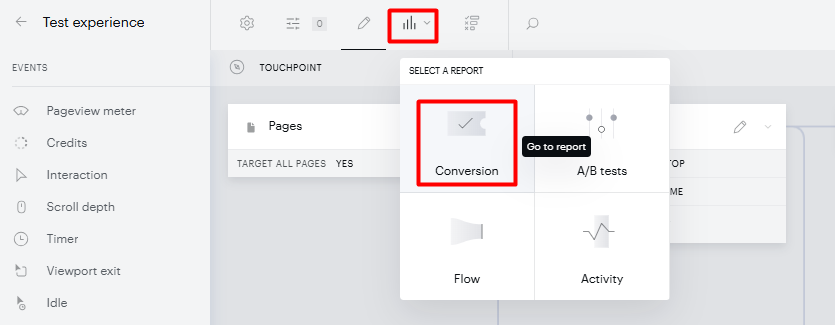
You can access the Composer Conversions Report by clicking the Reports dropdown either when editing an Experience:
Or in the Composer overview screen:
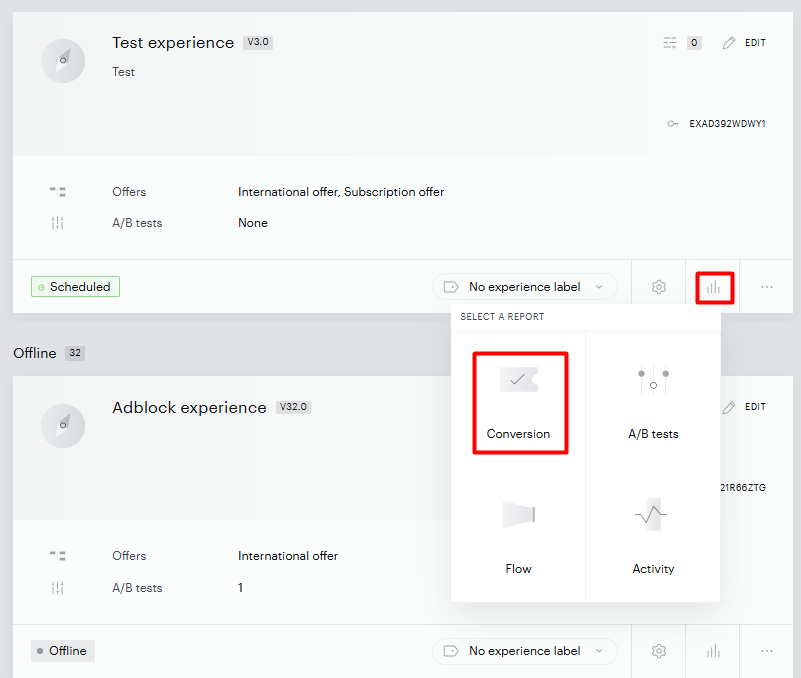
From the dropdown that appears, select the Conversion option to view the report.
Please note that if an experience was never activated, no data was collected, resulting in an error when viewing the report. To ensure data appears in the report, the experience version must be activated at least once.
Publishers may also sometimes reactivate experiences that were temporarily offline or deactivated for an extended period. Since our reports are not real-time and do not retrieve data for offline experiences, when an experience is reactivated, the related report data may take some time to regenerate for accurate display.
Main Chart
Once you have navigated to the report, you will see a large chart that graphs conversions over time.
You will see metrics that reflect holistic data at the top of the graphic, as well as a line-bar graph reflecting data for the specified time period.
Data Subsets and Filtering
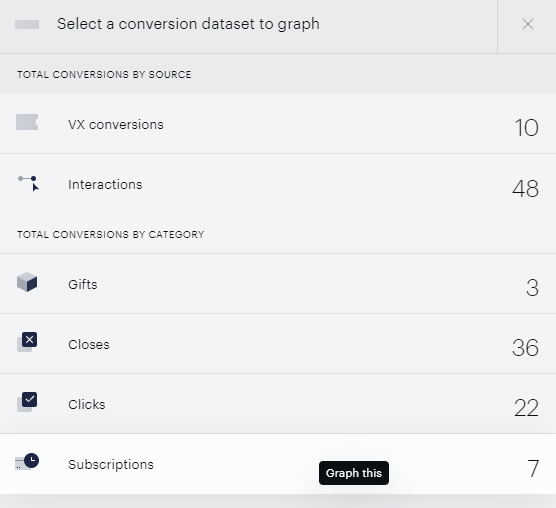
By default, you will be shown data on Management + Billing (VX) conversions. However, you can view other data subsets by clicking the pencil icon next to the label.

Doing so will reveal the list of data subsets available to graph on the chart, including sources of conversions such as Management + Billing (VX), ESP, and external sources, or categories of conversions such as subscriptions, adblock disables, and more. In addition, on this report, you can also view interactions with a displayed template, segmented by clicks, closes, and link clicks.
In addition, you can choose to view the data by conversions or by exposures. To do so, click on the dropdown above the insight and choose which metric you would like to view.
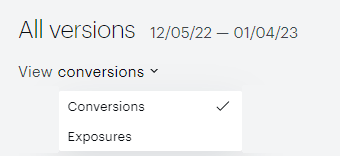
Once you select Exposures, you'll be able to drill down further into the exposures by source or category by clicking the pencil icon as shown below.
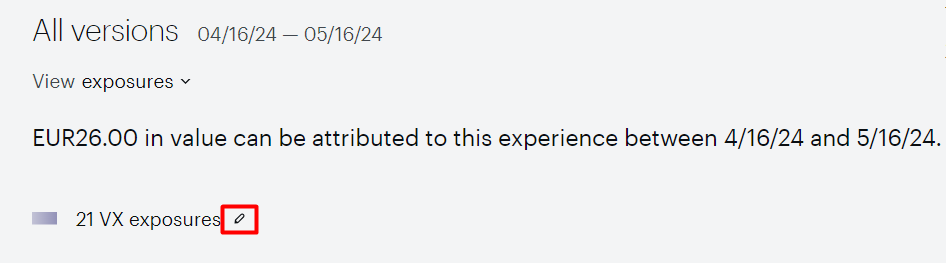
Management + Billing (VX) Exposures refer to the instances when an offer with a term is displayed to a user. This can occur either as a direct result of Composer's execution or through user interactions, such as clicking on a link (with a tracking ID parameter) within a template that leads to a page where the offer is shown. Essentially, Management + Billing (VX) Exposures track how many times users are presented with an offer with a term.
If you select a conversion-based data subset, the number of exposures and conversions, and the conversion rate are available when hovering, while the number of clicks, or closes & closure rate, is available when graphing interactions.
As an interaction, we consider a click, close, or external link contained in a template (potentially any other custom external event that you've specified in the template's HTML).
The interaction rate reflects the percentage of exposures that resulted in an interaction.
We also support tracking of exposures and clicks from Content recommendation templates.
Since the sending and collecting of metrics for content recommendation modules in our two Products - Composer and Content - is based upon different logic, the click counts you see inside the Content GUI or if you look in Insight might differ from those shown in the Composer Conversion report.
To retrieve detailed information about the vCTR (Visible Click-Through Rate) and Visible impressions, you should navigate to the Content module's Performance report in the Content dashboard.
Finally, you can also select the timeframe and experience version for which you would like to view data. Click on the option in the upper right of your screen to bring up the following dropdown:
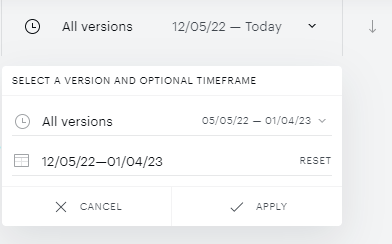
From here, you can choose the version and time range, respectively. You can elect to view data for all versions of the experience or to narrow the data to a single version. Clicking Apply will update the main visual and the table below to include only the data you specify.
Notes: The time period will have restrictions based on which experience version you select. In other words, you will not be able to set a time frame that begins or ends outside of the period for which the chosen experience version was active. Additionally, you may select a date range consisting of up to 180 distinct data points, i.e., 180 days, weeks, months, or quarters. If the selected date range contains too many data points, use a higher interval (e.g. aggregate by week instead of day) or shorten the time range.
Data Definitions
Piano relies on a standard set of data definitions for the numbers we provide in our reports. To make it clearer, we have embedded these definitions in appropriate areas of the Composer conversions report so you can reference them at any time. To verify how Piano defines the scalar values that drive the report, simply hover over that value in the upper right of the main visual or hover over the appropriate column heading in the table data below.
Please note that in case the user buys a subscription outside of a Composer experience, we set the value of the offer template name as Default Offer template. The same name is used in case you do not define a specific offer template in the "Show Offer" Action card in Composer under the Template tab.
Exposure Currency Logic
In the Composer Conversion report, we show exposure counts based on the following simplified logic:
1. If the Action card is Show Offer and there are terms configured, these exposures will be linked with the term's currency. If there is no term configured, the exposure's currency will be the same as the conversion currency. If there is no conversion, USD is taken as the default exposure currency.
2. If the Action card is Show template, the exposure will be linked with the conversion currency. If there is no conversion, we take USD as the default exposure currency.
So, as you can see, exposures in Show offer cards without terms that did not lead to conversions will be shown as USD exposures. Also, Show template exposures without conversions will be shown as USD exposures. This may explain why you're seeing USD exposures even if your payment provider is configured with another currency. All non-purchase events (clicks, closes) have the USD currency by default.
Tabular Data
Grouping options
Below the main graphic, you will see a table containing the underlying data for the visual. You can choose to organize your data based on various classifications:
|
Classification |
Grouping |
Definition |
|
Source |
Management + Billing (VX) conversions |
A conversion on any Management + Billing term within an offer. |
|
Interactions |
A click, close, or external link contained in a template. You can also specify your own events to log. |
|
|
ID conversions |
A conversion within Identity Management. |
|
|
External conversions |
If you're using a third-party system for checkout and want to track a particular action from your users as a conversion, you can use Piano's server- or client-side APIs to do so. |
|
|
ESP conversions |
A conversion on or within an ESP template. |
|
|
LinkedIn Partnership |
A conversion within ID. |
|
|
Category |
Subscriptions |
A conversion on any Management + Billing term within an offer or an external subscription conversion. |
|
Link clicks |
A click on an external link contained in a template. |
|
|
Form submit |
Submission of an Identity Management custom form triggered by the Composer action card Show form. |
|
|
Clicks |
The events that you specified you would like to log. |
|
|
Closes |
A click which results in the dismissal of the shown template. |
|
|
Credits spent |
Credits redeemed by the user when intercepting with the offer related to the partnership with LinkedIn. |
|
|
Logouts |
Number of logout events after a user sees the device restriction template indicating they have exceeded the allowed number of logged-in devices. |
|
|
Uncategorized |
Used for conversions that are not associated with any category. Usually, this may be caused by an incorrect integration when sending the conversions via API, where no specific conversion category is passed. |
|
|
Template |
Your templates |
Conversions organized by which template the user was viewing. |
|
Action |
Show offer |
Conversions that occur on a given offer. |
|
Show template |
Conversions that occur on a given template. |
|
|
Run JS |
Conversions that are the result of a Run JS event. |
|
|
Device* |
Desktop |
Conversions that occur on desktop, organized by OS and browser combinations. |
|
Mobile |
Conversions that occur on mobile, organized by OS and browser combinations. |
|
|
Tablet |
Conversions that occur on a tablet, organized by OS and browser combinations. |
|
|
Location* |
Top markets |
Conversions in each of the highest-converting 15 states or provinces from around the world. |
|
Country |
Conversions in each of the highest-converting 15 countries. |
|
|
Pages** |
Page |
Conversions by URLs. |
|
Tag |
Tag |
Conversions by tags. |
|
Without grouping |
N/A |
Every combination of Template to Term to Action conversions. |
*: The data displayed is limited to 30-day ranges or fewer. Full data for your selected time period is available through the export.
**To enhance data privacy and manage the user interface effectively, there is a restriction on URL data displayed within the UI, limited to a 31-day timeframe. If you require data spanning a period exceeding 31 days, you need to utilize the data export to CSV functionality in the top right corner of the screen.
When you request URL data for a duration beyond the 31-day limit, a notification message will be displayed in the respective table, informing you of the restriction.

Please note that for a cleaner overview, all links are truncated, i.e., displayed without any URL parameters.
Custom Conversion Values
Within this report, you have the ability to assign or alter the value of a conversion that occurs within this specific experience. By default, the Management + Billing (VX) conversions are associated with their actual value (i.e. the term's trial price or the term's full subscription price, whichever applies to the user's conversion), but even that can be altered.
You may overwrite the name and value of any of the conversion types, even values associated with terms. To do so, simply click the pencil icon on the right side of your screen in line with the conversion type you wish to modify. This will bring up an interface that allows you to customize the properties of this conversion type for all instances in the report.
You may also choose to completely hide the conversion by toggling the 'Count towards conversion' selector. This will exclude the element from any graph and not count the row in any total. This is useful for any clicks which do not actively count as a conversion or assist in adding value to the experience.
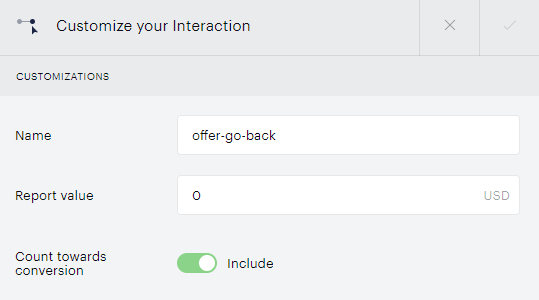
Customizations remain constant within this report for the current experience, across sessions and users. You can revert to the original settings at any time by clicking the text that says Reset to default value at the bottom of this interface.
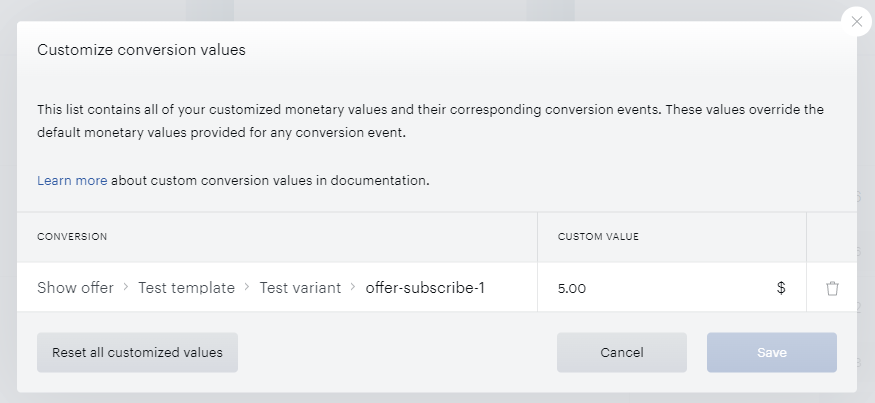
You can view all customized values by clicking the icon at the top of the table:
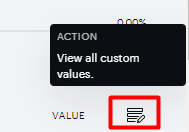
This will list any changes to the default values that you have made. You can choose to remove a custom value by clicking the trash icon next to it, or you can Reset all customized values by clicking the appropriate button. Be sure to save your changes if you would like them to apply.
Exporting Data
You can export the raw data underlying the Composer conversions report as a CSV at any time. The export will provide the data for the time range and experience version you selected, and it will use any custom conversion values that you may have provided.
To begin the export, click the icon in the upper-right corner of your screen:

Doing so will allow you to choose between two export options:
-
Download current page as CSV
-
Download entire report as CSV
Choosing to Download current page as CSV will initiate a CSV download that provides data only for the currently-selected table state. Choosing to Download entire report as CSV will initiate a ZIP download that contains a separate CSV for each possible table state.
Generating the entire report CSV export may take a few seconds, and the download will automatically begin once the generation is complete.
Template interaction conversion report
Overview
The Template Interaction Experience currently provides two reports: the Flow Report and the Composer Conversion Report. Both reports can be accessed through the same icon in the experience navigation bar used for Site/App or AMP experience types (see How to Access).
The primary purpose of reporting for the Template Interaction Experience is to support active churn prevention. This involves evaluating how effectively churn was prevented, whether through subscription upgrades, abandonment of the cancellation flow, actual churn, or the collection of cancellation feedback.
The Conversion Report offers a high-level overview of key performance indicators (KPIs). Meanwhile, the Flow Report allows you to analyze the performance of each experience branch and identify opportunities to optimize the setup.
Conversion report metrics for template interaction experience type
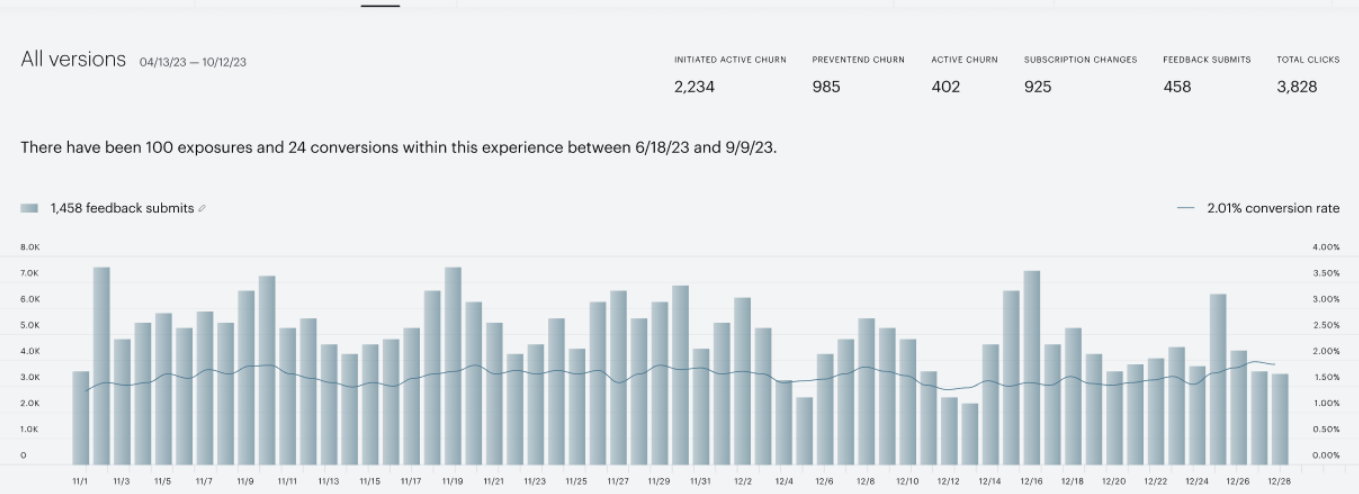
With Active churn prevention being the main use case for the template interaction experience, we do introduce new KPIs into the Composer conversion report and slight modifications to the report's structure and functionalities.
New KPIs
To analyze the performance of the active churn prevention and evaluate the prevented churn across all the experience versions within a selected time range, you can use the following KPIs:
-
Initiated active churn: Number of initiated active churn attempts to cancel the subscription or turn off autorenewal.
-
Prevented churn: Number of subscriptions for which the active churn flow was initiated but abandoned or which were upgraded to a different term. Scheduled subscription upgrades are excluded from this flow.
-
Active churn: Number of subscriptions for which autorenewal was turned off or which were cancelled.
-
Subscription changes: Number of subscription upgrade conversions. Scheduled subscription upgrades are excluded from this flow.
-
Feedback submissions: Number of submitted forms.
-
Total clicks: Number of clicks on the template or offer that didn't lead to its closure.
To analyze the results of the device restriction feature and its impact on template or offer impressions for users who have reached a certain limit of logged-in devices, you can use the following metrics:
-
Logouts: Number of logout events after a user sees the device restriction template indicating they have exceeded the allowed number of logged-in devices.
-
Logout rate: Ratio of logout events to template impressions triggered by the device restriction limit.
KPIs in chart options
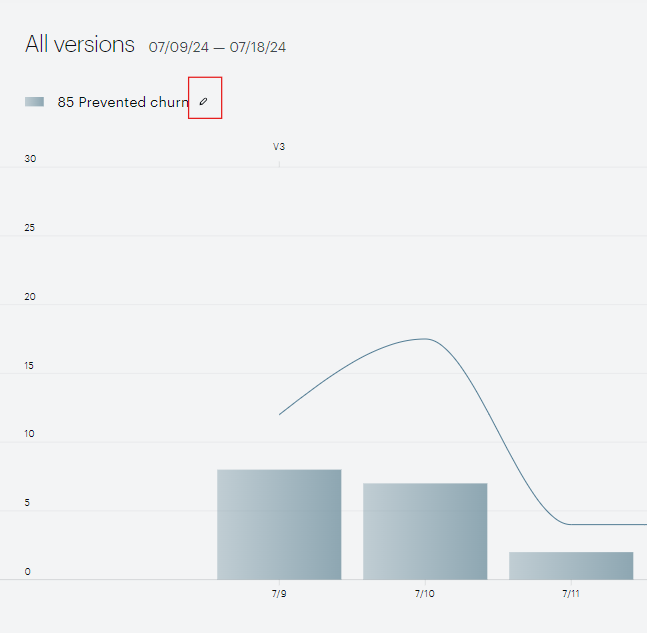
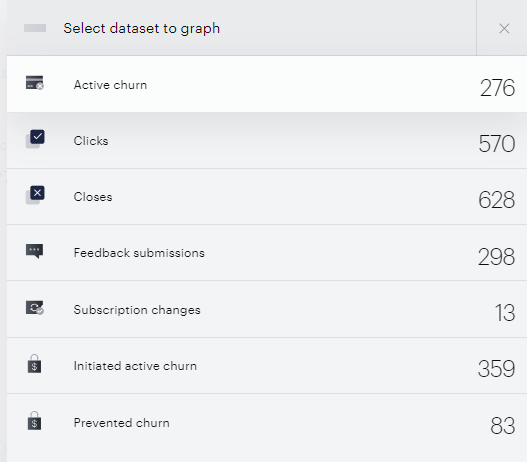
The list of KPIs in the chart options is different from the common Composer Conversion report and is adjusted to the Active churn prevention use case. If you want your chart to display any of the KPIs from the bar, click on the edit button next to the chart label and select the preferred metric.
Tabular data
The tabular data in the Composer Conversions report for Active churn prevention helps understand the total performance values across different breakdown views, including:
-
Category
-
Action
-
Location
-
Device
-
Template
-
or no grouping
There are 4 metrics available in the tabular form:
-
Exposures: Number of template, offer, or form exposures. This metric is calculated for actions that can be visibly presented to the website visitor instead of card exposures.
-
Events: Number of actions relevant for a specific event type and Composer object.
-
Rate: Percentage ratio of Events to Exposures.
-
Value: Monetary value of subscription upgrades.