
Introduction
Setting up analytics has always meant starting from scratch: building a data model, writing a tagging plan, briefing developers, and hoping the output matches what the business actually needs. Data Sources Studio changes that starting point.
Instead of a blank canvas, Piano Analytics provides structured data sources, each designed for a specific analytical purpose. Some require implementation work: a developer puts tags in place, you verify collection. Others will connect in a single click, pulling in external data without any tagging. Data Sources Studio is the single place where you manage all of them. Within each data source, you can also organize your tracking plan into sections — groupings of events and properties that reflect how your site is structured (for example, homepage vs. article pages).
Behavioral data sources are built around your industry. When you start with Piano Analytics, you select the industry that best describes your organization. That choice activates a pre-built tracking plan, a curated set of events and properties that reflect how your type of business measures performance. You tailor it to your specific needs, hand it to your developers through a ready-to-use implementation guide, and monitor collection until your out-of-the-box boards are ready to deploy.
Today, behavioral data sources cover web and app measurement (Core Analytics), industry verticals (Publishing, Retail, Banking, and more), and specialized analytical domains (AV Insights, Sales Insights). Contextual data sources, which connect external signals with a single click, are coming next.
Available Data Sources
Piano Analytics provides several data sources, each designed for a specific analytical domain. The table below summarizes what is currently available:
|
Data Source |
Description |
Board(s) Unlocked |
|---|---|---|
|
Core Analytics |
Foundation of behavioral analytics (page views, clicks, sessions, etc.). Activated for all clients. |
4 boards: Audience, Content, Technology, Traffic Sources |
|
Publishing |
Expert data source for media and publishing industry |
1 Publishing board |
|
Retail |
Expert data source for e-commerce and retail |
1 Retail board |
|
Banking |
Expert data source for banking and financial services |
1 Banking board |
|
Health |
Expert data source for health industry |
1 Health board |
|
AV Insights |
Behavioral data source for video/audio tracking |
1 AV Insights board |
|
Sales Insights |
Behavioral data source for e-commerce transaction tracking |
1 Sales Insights board |
We are already working on new industries that will be added in the future!
Key points:
-
Core Analytics boards deploy automatically if your site collects the
pageproperty on thepage.displayevent. -
Industry and additional boards deploy automatically once all "Board Required" items turn green in Monitor (i.e., 100% of required links are collected).
-
If a data source is not yet activated for your organization, you can add it yourself from the Data Sources Studio hub.
Access and navigation
-
Open Piano Analytics.
-
From the tool switcher, go to Data Management.
-
In the left menu, open Data Sources Studio. You land on Data Sources Studio, which lists all activated data sources for your organization.
Access rules
|
Action |
Requirement |
|---|---|
|
Tailor and Monitor |
Require Data Management permissions |
|
Implement |
Reachable via a public link (GUID) you can share with developers; validity 6 months, not revocable |
Navigation
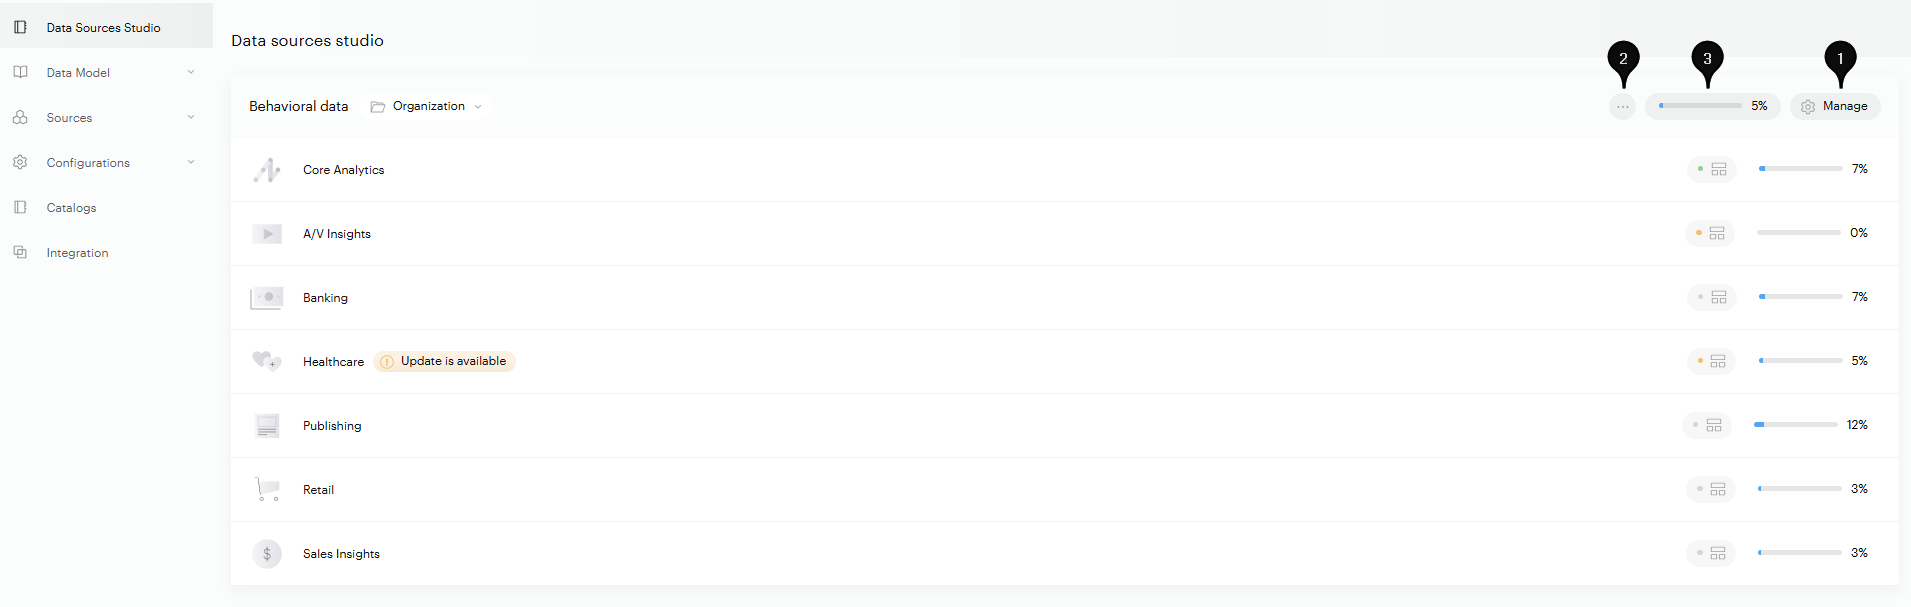
-
Tailor: access the default tracking plan and add or remove events and properties to adapt it to the specificities of your site.
-
Implement: generate or update the developer guide (same link is updated).
-
Monitor: verify collection over the last 30 days, focusing on "Board Required" items.
Note: Organization vs. groups of sites
The selector next to Behavioral data controls the scope of what you see. Organization is the default and covers every site in your organization, so a data source you tailor there applies everywhere. Open the dropdown to switch to a group of sites instead, which is useful when only part of your estate needs a given data source, for example a set of e-commerce sites that should carry Retail while your editorial sites stay on Publishing.
The 3‑step journey
Pro tip: start with "Board Required" items (lock icon). They're enough to automatically deploy an OOTB board for your data source.
Step 1 — Tailor: design your tracking plan
Tailor creates a clear, actionable implementation plan, based on your data source.
The Tailor interface
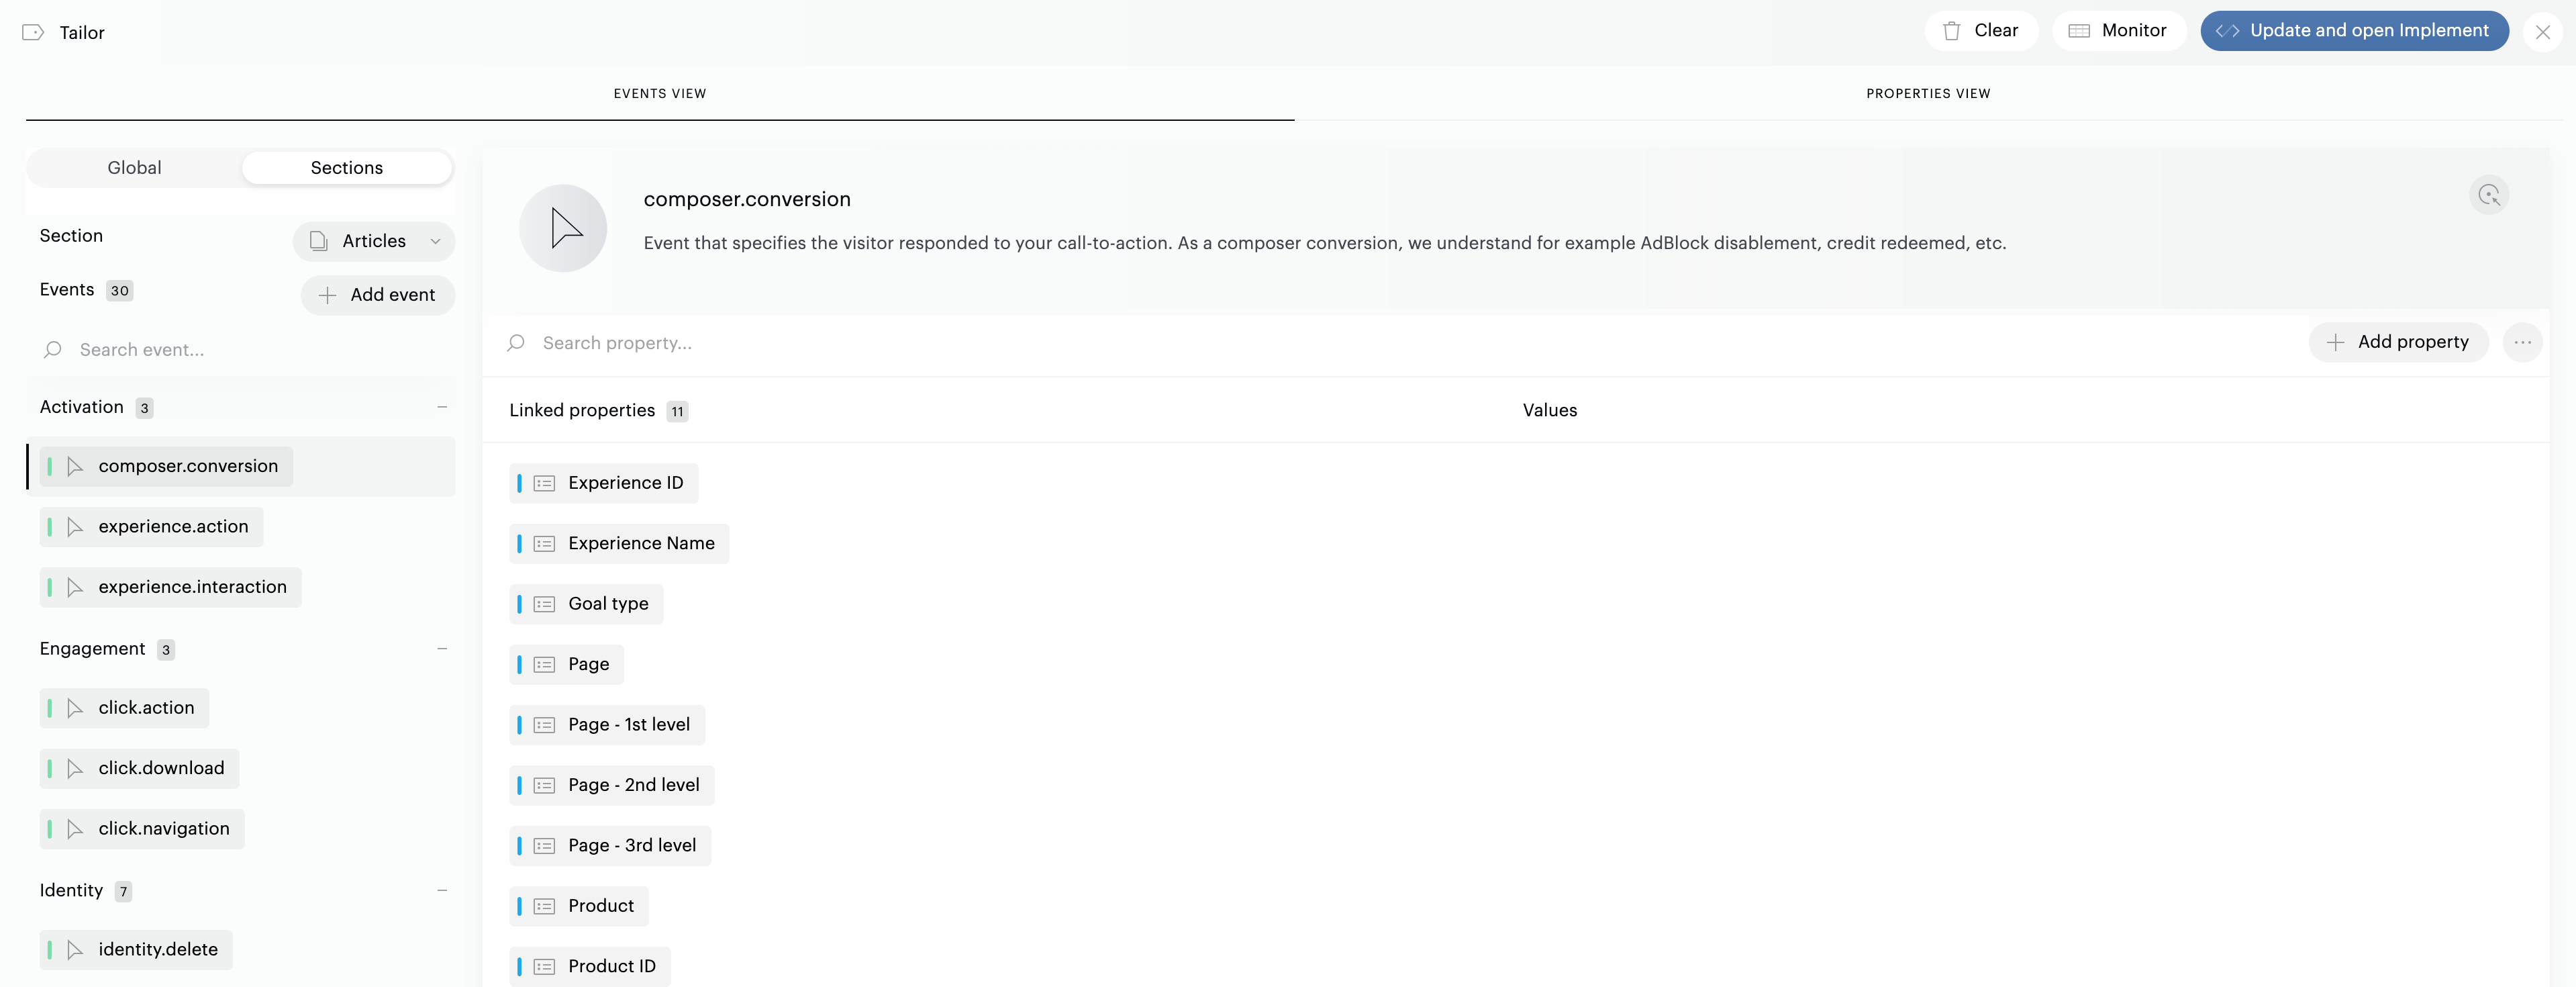
Two complementary views on top:
-
Events View: left column lists events; right panel shows their linked properties.
-
Properties View: left column lists properties; right panel shows their linked events.
Other elements:
-
Collapsible categories for easier reading.
-
A lock icon (🔒) for "Board Required" items (tooltip "Board Required").
-
A trigger description field under each event: a free-text area where you can describe when the event should be fired (e.g., "Send when the user reaches the end of a backward movement of the player's cursor"). This information is passed through to the Implement guide, giving developers the context they need to know exactly when to send each event.
-
A "Values" column to document default values to pass. This information is also passed through to the Implement guide, giving developers extra context.
-
An "i" button at the end of property rows: key, type, description, scope, category.
The unified tracking plan
Tailor displays a unified tracking plan that merges all your activated data sources into a single view. For example, if your organization has activated Publishing and AV Insights, the events and properties from both data sources appear together in Tailor. This means you work from one consolidated plan rather than switching between data sources.
Editing your tracking plan
From Tailor, you can:
-
Add or remove events from your plan.
-
Link/unlink properties to events (or vice‑versa in Properties View).
-
Define a trigger at event level (when to send it).
-
Set a default value at property level (e.g., Page = "Home Page") to guide developers.
-
Jump between views using the small hover arrow (cross‑navigation).
Organize your tracking plan into sections
By default, Tailor shows your full tracking plan in the Global view — every event and property activated for your data source, in one consolidated list.
For more complex sites, you can break the plan into sections: groupings that mirror the different types of pages or contexts on your site. For example, a publisher might create one section for the homepage and another for article pages, so the events and properties tracked on each can be managed independently.
Sections are child items of the Global view, not separate tracking plans. Any connection (an event linked to a property) created in a section automatically appears in the Global view as well. The Global view always shows the consolidated tracking plan across all sections.
At the top of Tailor, two tabs let you switch views:
-
Global — Shows the consolidated tracking plan across all sections.
-
Sections — Shows a single section at a time. Use the section dropdown to switch between sections.
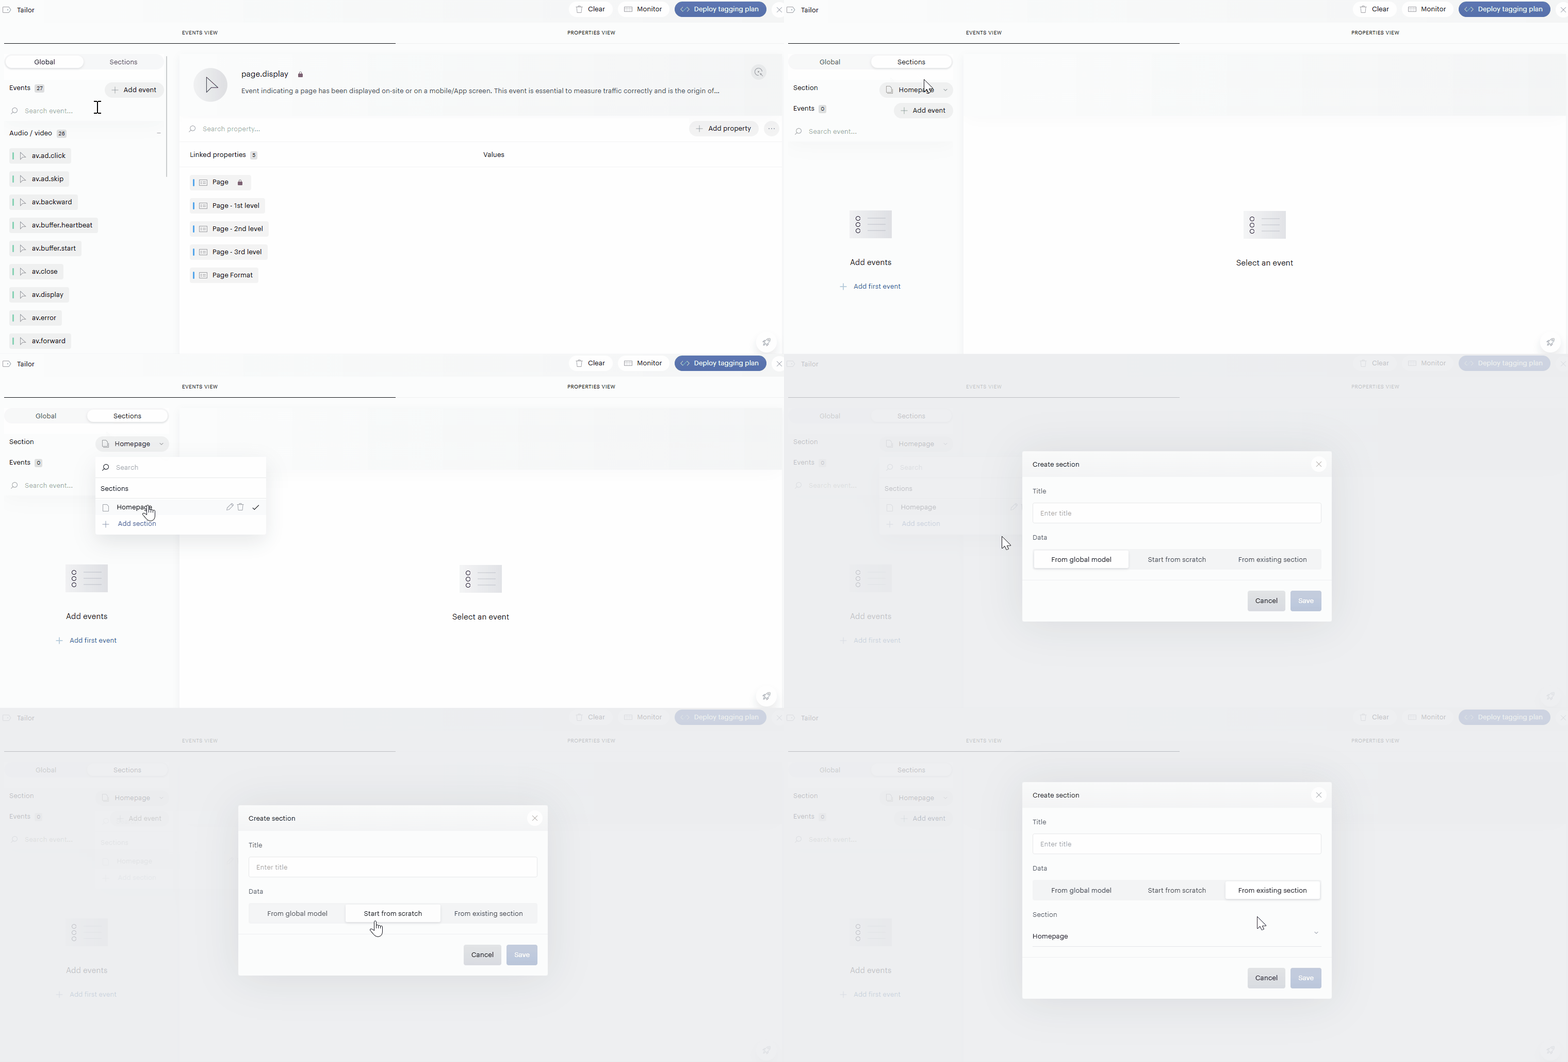
To create a new section:
-
Open the Sections tab.
-
Click the section dropdown and select Add section.
-
In the Create section dialog, enter a Title for the section.
-
Choose how to populate it:
-
From global model — Start with all events and properties from the global tracking plan, then refine.
-
Start from scratch — Create an empty section and add events and properties manually.
-
From existing section — Duplicate an existing section as a starting point.
-
-
Click Save.
The new section is added to the list and selected automatically. You can now add or remove events, link or unlink properties, and define triggers — just as you would in the Global view.
Events need at least one property to be saved. Adding an event to a section without linking any property won't persist — the event will be discarded. To keep an event in a section, link it to at least one property.
Manage sections:
From the section dropdown, you can also:
-
Rename a section — Click the pencil icon next to its name.
-
Delete a section — Click the trash icon. A confirmation prompt appears before deletion.
-
Switch the active section — Click any section name in the dropdown.
Rules and limitations
-
Tailor lists only "processed" properties (the ones your developers must send). Properties handled automatically by the SDK/processing are hidden.
-
"Board Required" items cannot be removed.
-
Supported property types: string, integer, date, array string, bool (and, in some cases, decimal).
-
Tailor changes are live. To expose them in the developer guide, click "Update data source."
-
Sections are optional. If you don't create any, your tracking plan stays in the Global view, exactly as before.
Step 2 — Implement: hand a turnkey guide to developers
Why a dedicated step?
To deliver a self‑customized guide that reflects your Tailor selection, values, and "Board Required" priorities. Get data by copy-pasting from Implement.
Link rules
-
Public link (GUID), valid 6 months, not revocable.
-
After every Tailor change, click "Deploy to Implement" to update the same GUID.
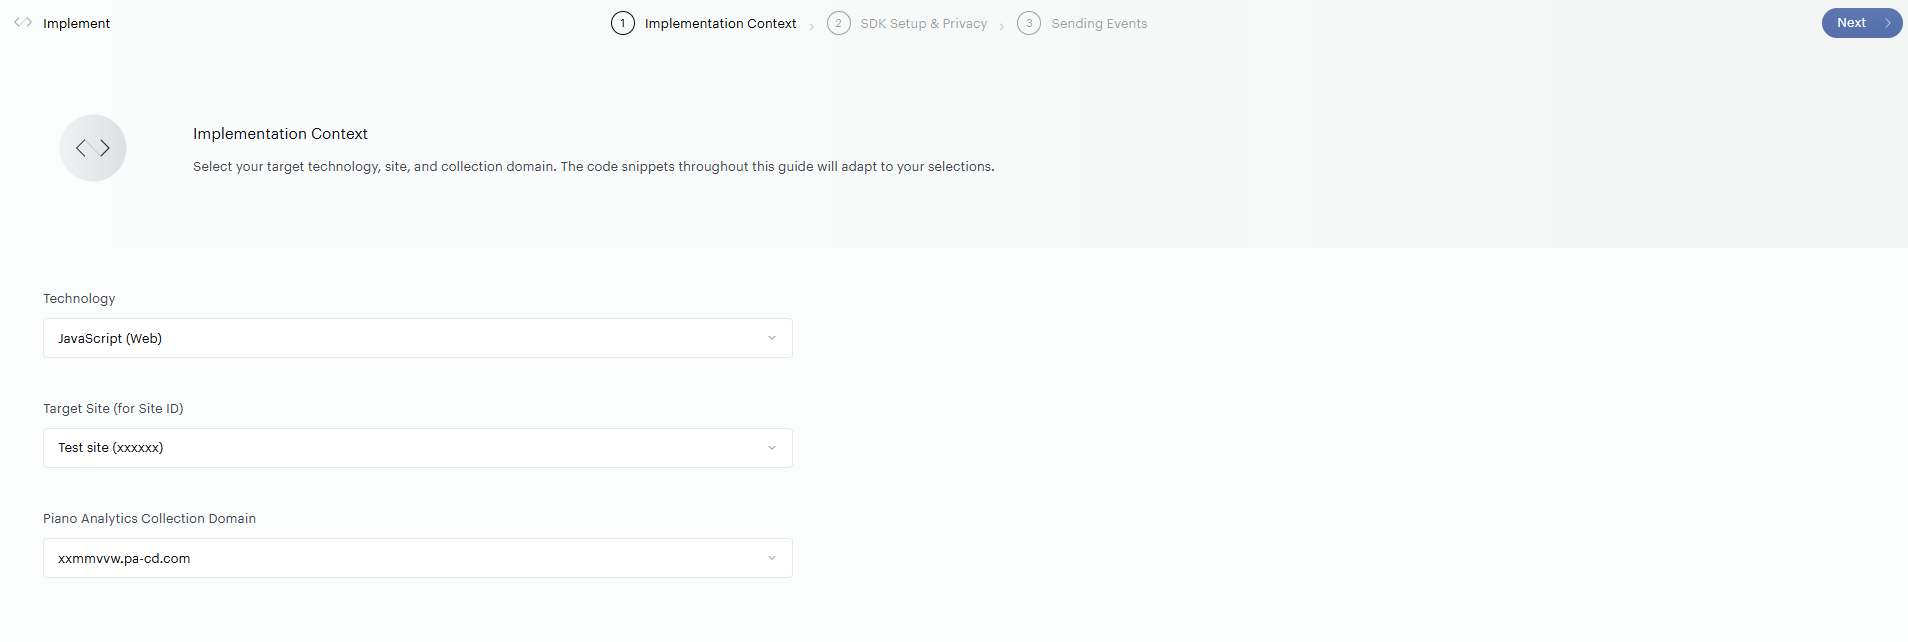
Implementation Context
-
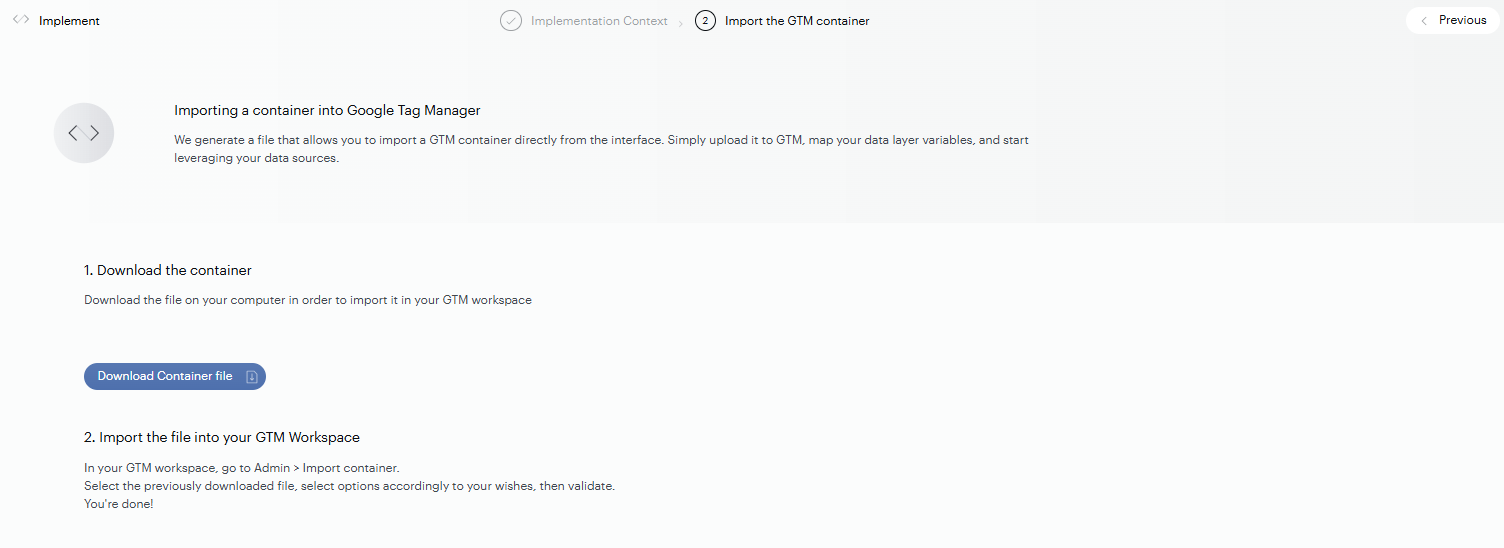
Technology: JavaScript and Google Tag Manager for now (Android and iOS coming soon).
-
Target Site (Site ID): pick your site; the ID flows into snippets.
-
Piano Analytics Collection Domain: choose the collection domain (including CDDC setups).
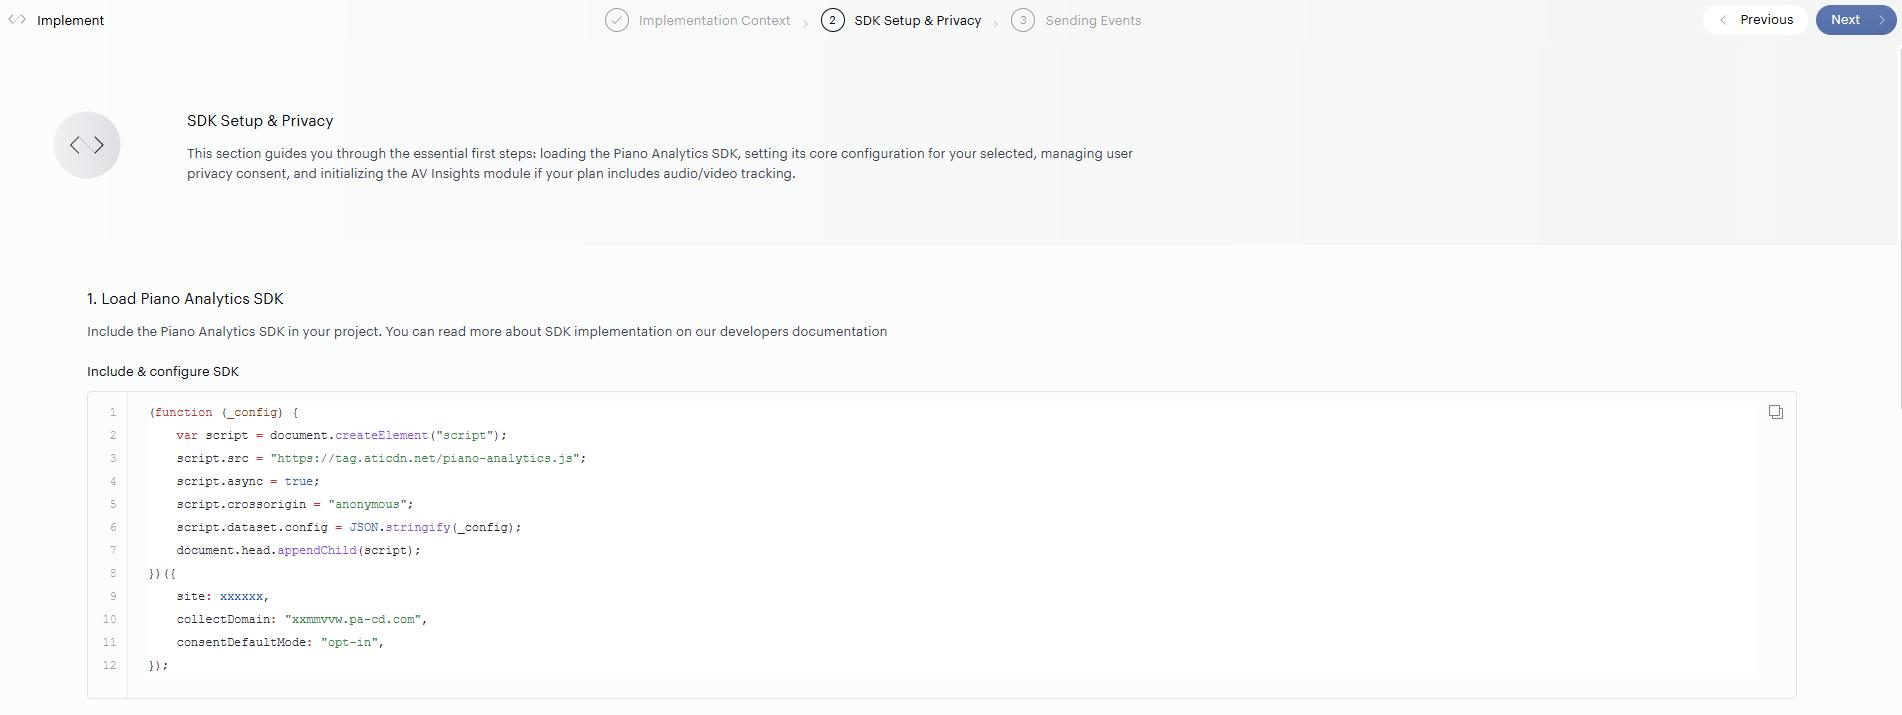
SDK Setup & Privacy
-
Include and configure the Piano Analytics SDK with a ready‑to‑copy snippet.
-
Set consent (Opt‑In, Essential, Opt‑Out) and User ID.
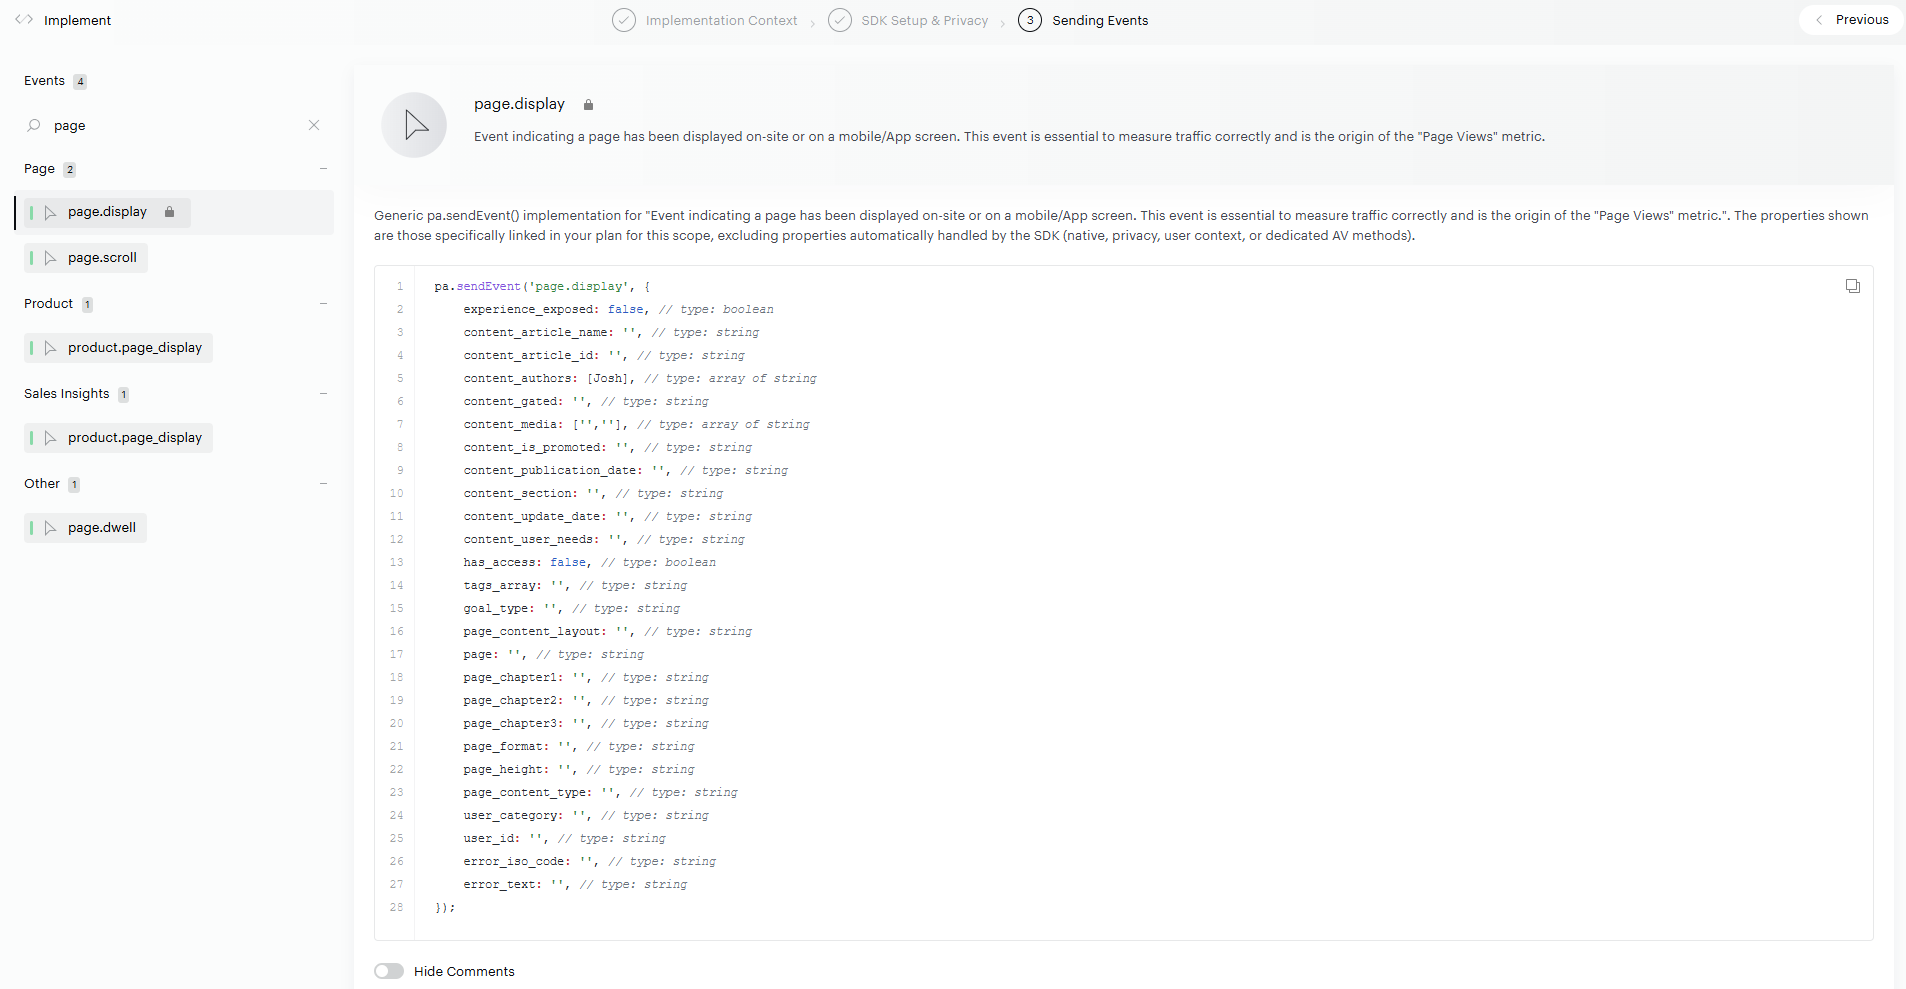
Sending Events
-
Left column: all events, locks on "Board Required."
-
Right panel:
pa.sendEvent()snippet for the selected event. -
Each property is commented (type + "board required" when applicable).
-
Actions: copy code; Hide Comments to hide inline comments.
Code snippets (JS excerpts — exact script URL is provided in Implement):
// 1) Load SDK with your context
(function (_config) {
  var script = document.createElement("script");
  script.src = "https://tag.aticdn.net/piano-analytics.js";
  script.async = true;
  script.crossorigin = "anonymous";
  script.dataset.config = JSON.stringify(_config);
  document.head.appendChild(script);
})
  ({
  site: xxxxxx,
  collectDomain: "bpwphks.pa-cd.com",
  consentDefaultMode: "opt-in"
});

// 2) Consent
pa.consent.setByPurpose("AM", "opt-in"); // or "essential" | "opt-out"

// 3) Send an event
pa.sendEvent("internal_search_result.click", {
  ise_keyword: "",      // string
  ise_page: 0,          // integer
  ise_click_rank: 0     // integer, board required
});
Sharing tips
-
Share the Implement link through a secure internal channel (the link is public).
-
After any Tailor change, "Deploy to Implement" before sharing again.
Step 3 — Monitor: verify collection and prioritize
Monitor provides a matrix that shows, for each event × property, whether you collect what you planned.
Reading the matrix
-
Y‑axis: events (collapsible categories).
-
X‑axis: properties (collapsible categories).
-
A two‑arrows button to flip axes.
-
Locks on "Board Required" items.
Cell statuses
|
Display |
Expected? |
Received? |
Meaning |
|---|---|---|---|
|
Empty cell |
No |
No |
Nothing expected, nothing received |
|
⚪ |
Yes |
No |
Expected but not received |
|
🟢 |
Yes |
Yes |
Expected and received |
|
🟠 |
No |
Yes |
Not expected but received |
Hover over any cell to get detailed information about that specific link, including the property name, the associated event, the current status (e.g., "Approved" or "Not received"), and — when data has been collected — the last received count and timestamp.
Reading tips
-
Time window: last 30 days — refresh rate: every minute.
-
All "Board Required" turning green triggers automatic deployment of your OOTB board.
-
Start by scanning locks and hunt for grey dots first: these are your top actions.
-
Orange dots (not expected) highlight implementation drifts: a property may be sent under the wrong event. Click on it to approve it and add it to Tailor.
Understanding your completion scores
The Data Sources Studio hub shows two completion metrics for each activated data source:
-
Global completion: the percentage of all links (event × property combinations) in the data source that are being collected. This shows overall adoption of the data source.
-
Required completion: the percentage of required links only. Reaching 100% required completion unlocks the corresponding OOTB board automatically.
What is a link? A link is the connection between an event and a property in your tracking plan. For example, if the event page.display is associated with the property page, that pairing is one link. A required link is a link marked as "Board Required" (🔒) in Tailor — it represents a data point that must be collected for the OOTB board to deploy.
What does a low global completion mean? A low global completion with a custom data model is not a problem — it simply means you use custom properties outside the standard data source. The required score is what matters for board deployment.
Example — a Retail client:
-
Core Analytics: 100% required → ✅ 4 boards deployed
-
Retail: 29% global, 80% required → 🔒 Board locked (need 100% required — close!)
-
Sales Insights: 58% global, 100% required → ✅ 1 board deployed
This client has 5 boards deployed (4 Core + 1 Sales Insights) and is close to unlocking the Retail board. They can click into the Retail data source to see exactly which required links are missing. Once they hit 100% required, the Retail board auto-deploys.
Why adopt Data Sources Studio, even with a custom data model? By aligning even part of your data model with Piano's standard data sources, you progressively unlock OOTB boards — ready-made dashboards that deliver insights with zero configuration. And because Piano's AI features — such as smart recommendations and anomaly detection — rely on normalized, well-structured data, every data source you complete makes these capabilities more accurate and relevant to your business. In short: the more you invest in Data Sources Studio, the more value Piano Analytics returns.
OOTB Boards: when are they deployed?
-
Automatically once every "Board Required" item is green in Monitor.
-
If one later turns grey, the board remains deployed but may become partially inaccurate.
-
Boards appear in Piano Workspace, the landing page of Piano Analytics — clients see only the boards they have data for.
-
Core Analytics boards (Audience, Content, Technology, Traffic Sources) are available to everyone who collects basic page data.
-
Industry and additional boards unlock when 100% of required links are collected.
Pro tip 1: want to easily identify which mandatory properties are missing? Click on the Info button > Required links for Board deployment > Missing links
Pro tip 2: after each production release, check Monitor: when all locks are green, your OOTB board is ready. There is a 1min cache, so refresh the page to see updated statuses.
First‑deployment checklist (30–60 minutes)
-
In Tailor:
-
Select your data source (Core Analytics, Publishing, Retail, etc.).
-
Add/remove events to match your scope.
-
For each key event, define a clear trigger.
-
For sensitive properties, set default values when helpful.
-
Prioritize "Board Required" items.
-
-
Publish to Implement:
-
Click "Deploy to Implement," then share the link.
-
In Implement, pick Technology = JavaScript, your Site, and Collection domain.
-
Copy SDK initialization and the consent policy (Opt‑In / Essential / Opt‑Out).
-
Copy snippets for priority events.
-
-
Control in Monitor:
-
Check the last 30 days.
-
Tackle grey dots on "Board Required" first.
-
Fix not‑expected sends (orange dots).
-