
Along with the Campaign Overview, Audience Insight is the main report in the Campaign Reporting functionality. To open it, select Campaigns in the Radar dropdown, then click your campaign on the list and select its Audience insight tab.
Overview
Every report consists of the following parts:
-
The selected campaign information:
-
Name and ID of the selected campaign.
-
Advertiser's name.
-
Here you can find the link "All campaigns" which allows you to come back to the list of all campaigns.
-
-
Campaign row selector - drop-down list of all campaign rows of the selected campaign. You can choose one of the available rows and the Audience insight report will be recreated. Campaign rows in this selector are ordered by Alphabet.
-
“Summary”.
-
Segment groups.
Learn how to download campaign reports here.
Summary section
This section consists of the main metrics available for the selected campaign/campaign row and depends on the ad server's data:
-
Impressions.
-
Clicks.
-
CTR.
-
Users.
-
In screen (Avr).
For now, there are several main sources for these metrics: ad server (information can be received from the ad server by using API) and log files. Some data can be received through the wrappers.
It's common behavior when on a date some information can be only in log files, for example, or only in the ad server. After some days the information can be available in both sources. In this case, we prefer to show data received from the ad server instead of log files.
In the Overview and Audience Insight Reports, we use the same source for the same metrics which means that for example, Impressions should be equal to each other in both reports.
Segment groups section
The main goal of the Audience Insight Report is to show the campaign's statistics distributed by the audience of the segments.
In this section of the report, you can find all your segment groups, first of all, socio-demographic such as Age, Gender, also Interest group, and all others.
It is very important to configure your groups that way which allows you to see the clear, understandable statistic for each segment in the group.
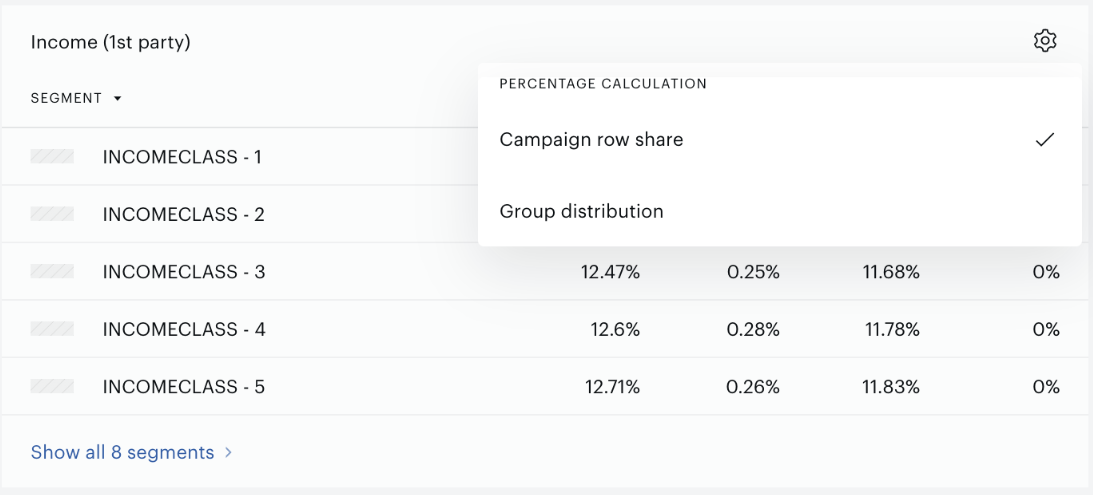
For each segment in the segment group, there are the following metrics: Impressions, CTR, Users, and In screen (avg).
"In screen (avg)" per segment can be calculated only if the customer uses tags instead of GAM log-files.
Percentage calculation
Customers can choose how the segment metrics within the segment groups should be calculated.
There are two possible options that are available:
-
Campaign row share
-
Group distribution
Group distribution makes sense to use if segments’ audiences are not overlapped with each other within the segment group. For instance, the “Female” and the “Male” segments in the “Gender” group. All percentages are calculated within the group.
In this case: Impressions, % for the segment = ((Impressions for the segment)/(Summa of all impressions of all segments in the group))*100
Campaign row share makes sense to use in cases when audiences of the segments are overlapped with each other, for example, in Interest segments.
In this case: Impressions, % for the segment = ((Impressions for the segment)/(Impressions of the selected Campaign row))*100
Images
In the Audience insight report, we display images for top-5 segments based on their Impressions, % metrics.
In Piano Audience 29 predefined images for the IAB, Interest segments were uploaded so far. For all other segments, if you want to use this functionality, custom images should be uploaded by customers.