
A dedicated board lets you monitor your Billing usage at any time, without having to request a manual extraction each time. This article explains how to access the board, read the data, and answer the most common questions about your usage.
Overview
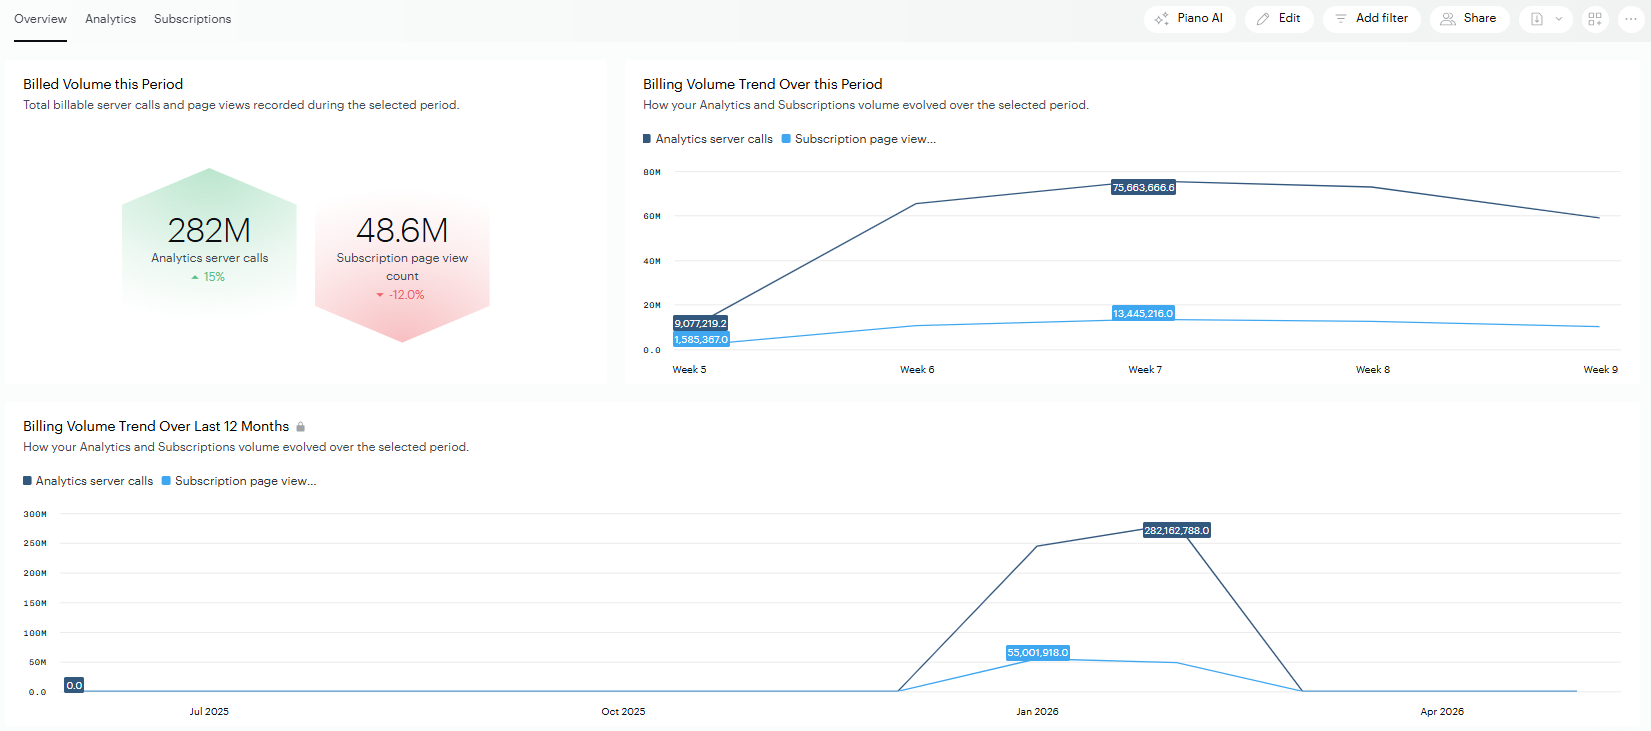
The following board gives you a daily view of your Billing usage consumption across your sites. You can:
-
Check your usage at any time, without contacting Piano.
-
Filter the data by site (using the site ID or site name).
-
Export the data, or schedule a recurring email delivery (see Subscribe to a board).
-
To get initial access, please contact the Support team.
Accessing the board
Switch to your billing organization
Your billing data is stored in a separate organization from your analytics data. This means you'll need to switch organizations to view it.
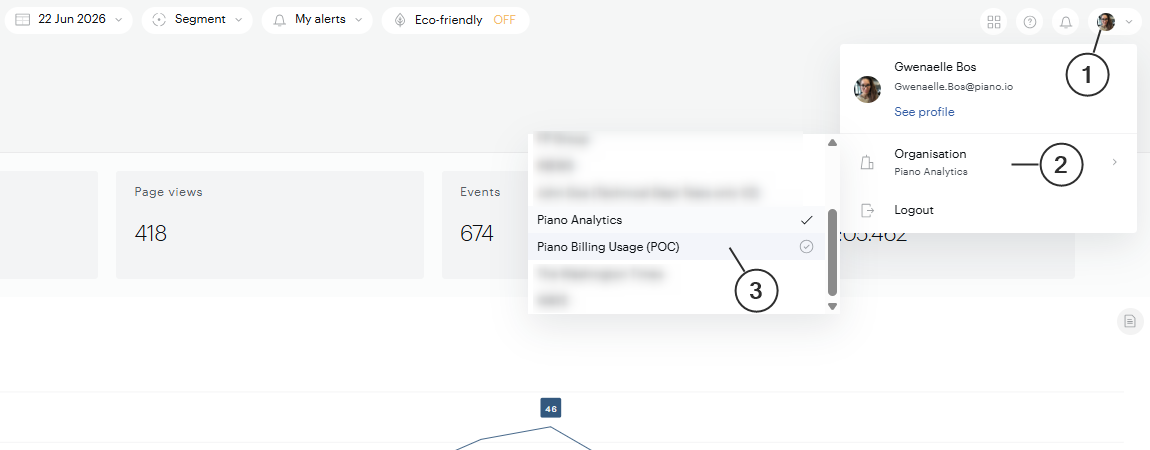
To switch:
-
Click your profile picture in the top-right corner of Piano Analytics.
-
Under Organisation, click the current organization name to open the list.
-
Select the organization named Your organization name (Usage).
The page reloads in the billing organization, and the board becomes available in the Library.
Who has access
When your billing organization is created, one admin user in your company is granted access. That admin can then invite additional users and manage their access rights. For example, granting view-only access to a member of your finance team.
If you don't see the billing organization in your switcher and you think you should, contact our support center.
Limit access to specific sites
Billing data can be sensitive, and not everyone in your company needs to see the usage of every site. For example, if several brands or entities share the same contract, each one may need to see its own usage without seeing the others'.
To do this, the admin can create users with the Business user role and give each team access to its own sites only. Each user then sees the usage of their team's sites and nothing else.
Note: users who get access through a team can't schedule recurring email deliveries of the board.
Understanding & Reading Your Data
Billing usage definition:
Unit Piano uses to measure your consumption. The unit depends on the product:
-
Server Call (SC): Used for Piano Analytics. As a general rule, one event received usually counts as one Server Call. Some specific events may count for less (for example, 0.1 SC). The exact rules that apply to you are defined in your contract.
-
Page view count: Used for Piano Subscription. Counts the page views generated on your sites.
The board is split into pages (tabs at the top of the board). Each page focuses on a different view of your usage. Please note that the board is updated once a day and shows data up to the previous day. Today's usage will be visible tomorrow.
The "Overview" page
The Overview gives you the big picture of your usage for the selected period:
-
Billing Analytics: Your total Piano Analytics Server Calls, with the trend over time.
-
Billing Subscription: Your total Piano Subscription page views, with the trend over time.
The Subscription page only displays data if your organization has subscribed to Piano Subscription. If you only use Piano Analytics, this page will show "No values for this metric" or "No results were found for this query", that's expected and doesn't mean there's a problem with your data.
The "Piano Analytics" page
This page breaks down your analytics usage in more detail:
-
Main PA events: The types of events generating Server Calls, so you can see which event types drive your usage.
-
Main PA sites: Your top sites by Server Call volume.
-
Events for main PA sites: A breakdown of which event types contribute to usage on each of your top sites.
The "Subscription" page
If you've subscribed to Piano Subscription, this page shows your Subscription usage. Data is broken down by AID and Billing ID for further analysis.
Filtering and adjusting the view
At the top of the board, you can adjust:
-
Sites: Use the site selector to focus on a specific site or group of sites. You can search by site ID or site name.
-
Date range: Pick the period you want to analyze.
-
Comparison: Compare the selected period with the previous one to see how your usage has evolved.