
The Overlap Report in Piano Audience enables analysis of intersections between multiple segments within a site group. This helps optimize segmentation by identifying redundancies, confirming mutually exclusive audiences (zero overlap), and improving targeting efficiency.
The report supports both User segments (overlaps based on unique users) and Contextual segments (overlaps based on URLs/pages). Use the tabs at the top of the page to switch between User segments and Contextual segments. Summary metrics and overlap calculations update automatically based on the selected type.
How to Access the Overlap Report
-
Select your site group.
-
In the Reporting dropdown, choose Overlap.

Key Features
The report includes:
-
Summary metrics at the top (aggregated for the selected segment type across the site group or customer, depending on configuration).
-
Main view (table-based comparison).
-
N-set diagram tab with Circle, Venn and Table visualizations.
-
Filters, view options (e.g., %, absolute values, heatmap), fullscreen mode, and sorting.
Summary Metrics
Displayed at the top and tailored to the segment type:
-
For User segments:
-
Full audience: Total unique users in the site group (over the last 30 days or your configured LTS period).
-
All page views: Total pageviews (over the same period).
-
-
For Contextual segments:
-
Total segments URLs: Distinct URLs across segments.
-
Total active URLs: URLs with recent activity.
-
Total active users: Users with recent activity (may be shown for context).
-

A label indicates whether metrics are calculated by site group or customer level (based on feature flag).
Main View
The Main view displays a comparison table where:
-
The first (leftmost) column lists the base segments — one per row. These serve as the reference point for each comparison.
-
The remaining columns show the other selected segments.
-
Each cell shows the overlap between the row’s base segment and the column’s comparison segment:
-
Percentage — share of the base segment also present in the comparison segment
-
Absolute number — overlapping users (User segments) or URLs (Contextual segments)
-
-
Diagonal cells (base segment compared to itself) display 100% and the segment’s total size (its share of the site-group audience and absolute count).
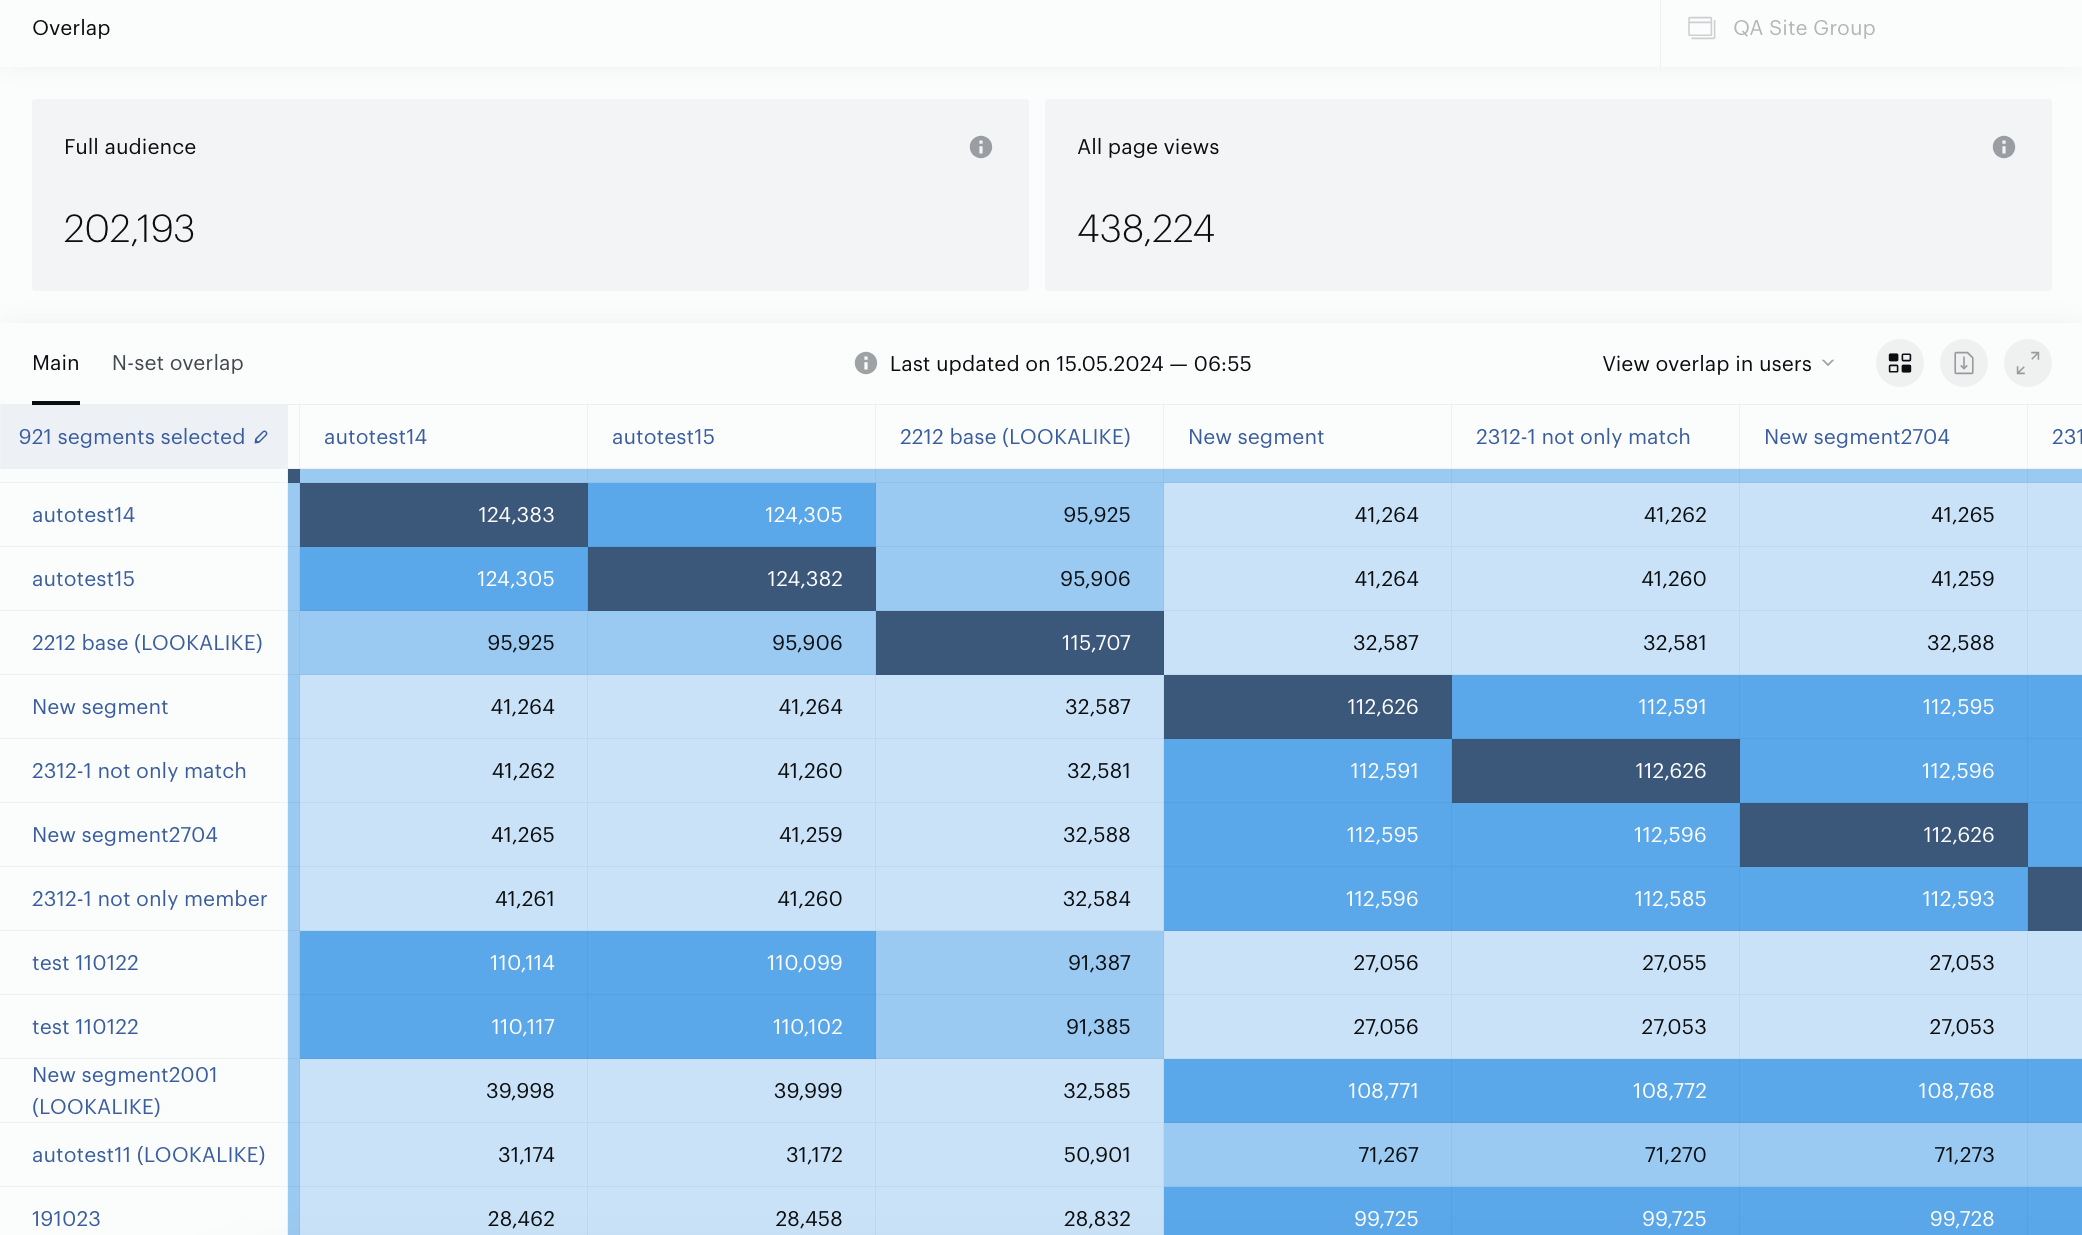
The table is row-oriented: each row tells the story of one base segment’s overlap with every other selected segment. Overlap percentages are directional — the value in row A / column B (% of A in B) may differ from row B / column A (% of B in A).
Controls
-
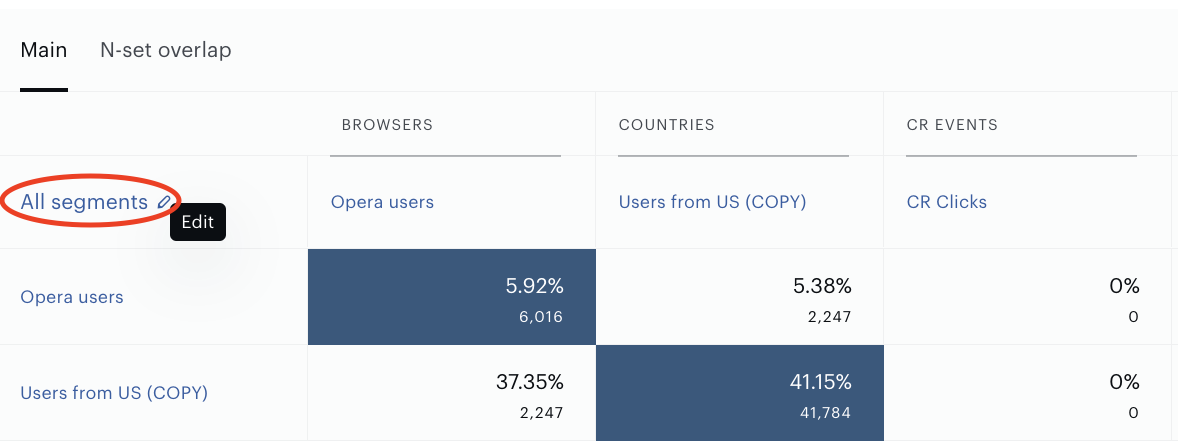
All segments button — select up to 5,000 segments for comparison
-
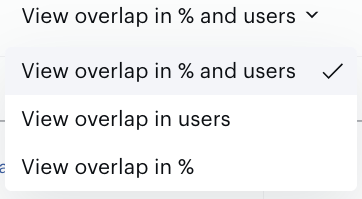
View dropdown — toggle between %, absolute values, or both
-
Heatmap — color-codes overlap strength (light blue: 0–50%, blue: 51–90%, dark blue: 91–100%)
-
Expand — fullscreen mode for easier viewing of large selections
N-set Diagram Tab
This tab offers visual representations of overlaps for the currently selected segments. Segment selections carry over from the Main view or can be adjusted directly here using the segment selector (add via + button, remove via x, or copy/paste IDs). Switch between the three diagram types using the selector dropdown.
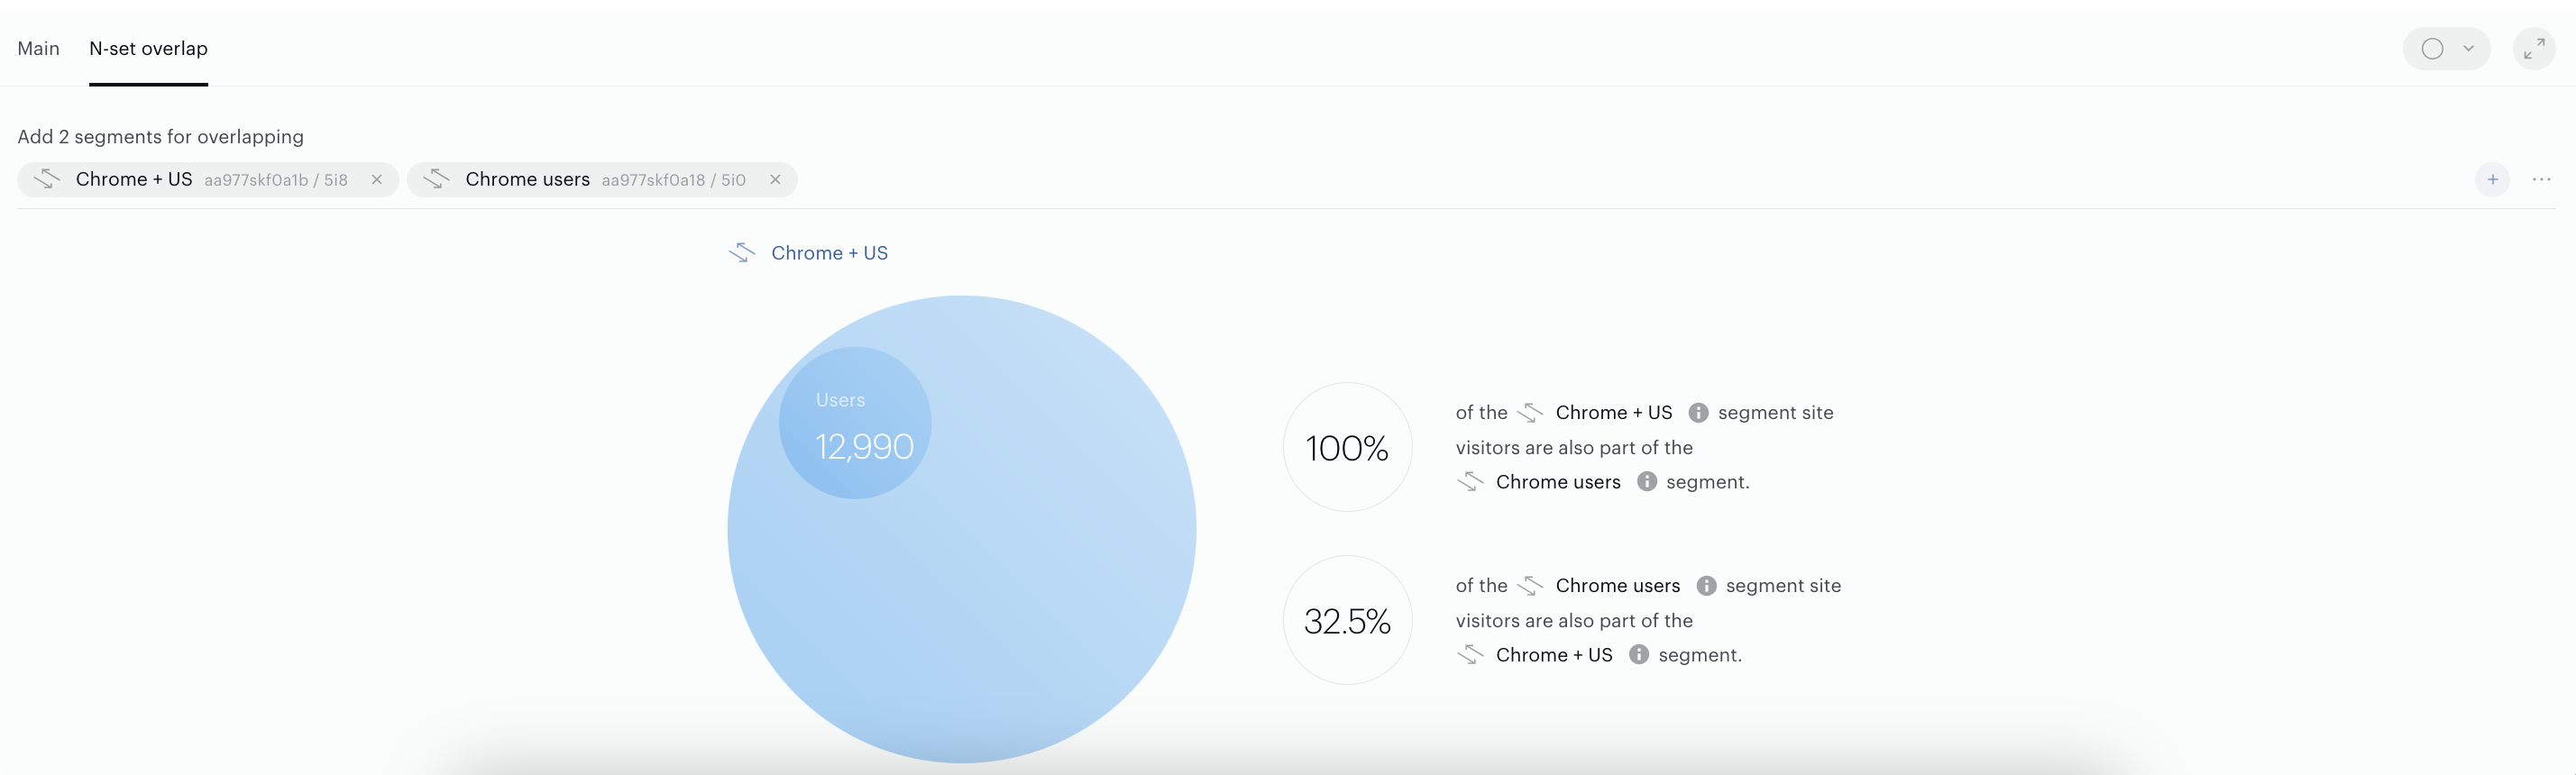
Circle diagram (2 segments)
Displays two circles representing the segments. Circle size reflects segment scale, while position and overlap area indicate similarity:
-
Separate circles = no overlap
-
One inside the other = full inclusion
-
Partial overlap = shared portion visible Shows segment names, total sizes (users or URLs), and exact overlapping count. Ideal for quick pairwise checks.
Venn diagram (supports 2-4 segments)
Classic overlapping circles (or ellipses) showing all unique and shared subsets.
-
Colored regions highlight intersections; transparent areas indicate non-selected or empty subsets.
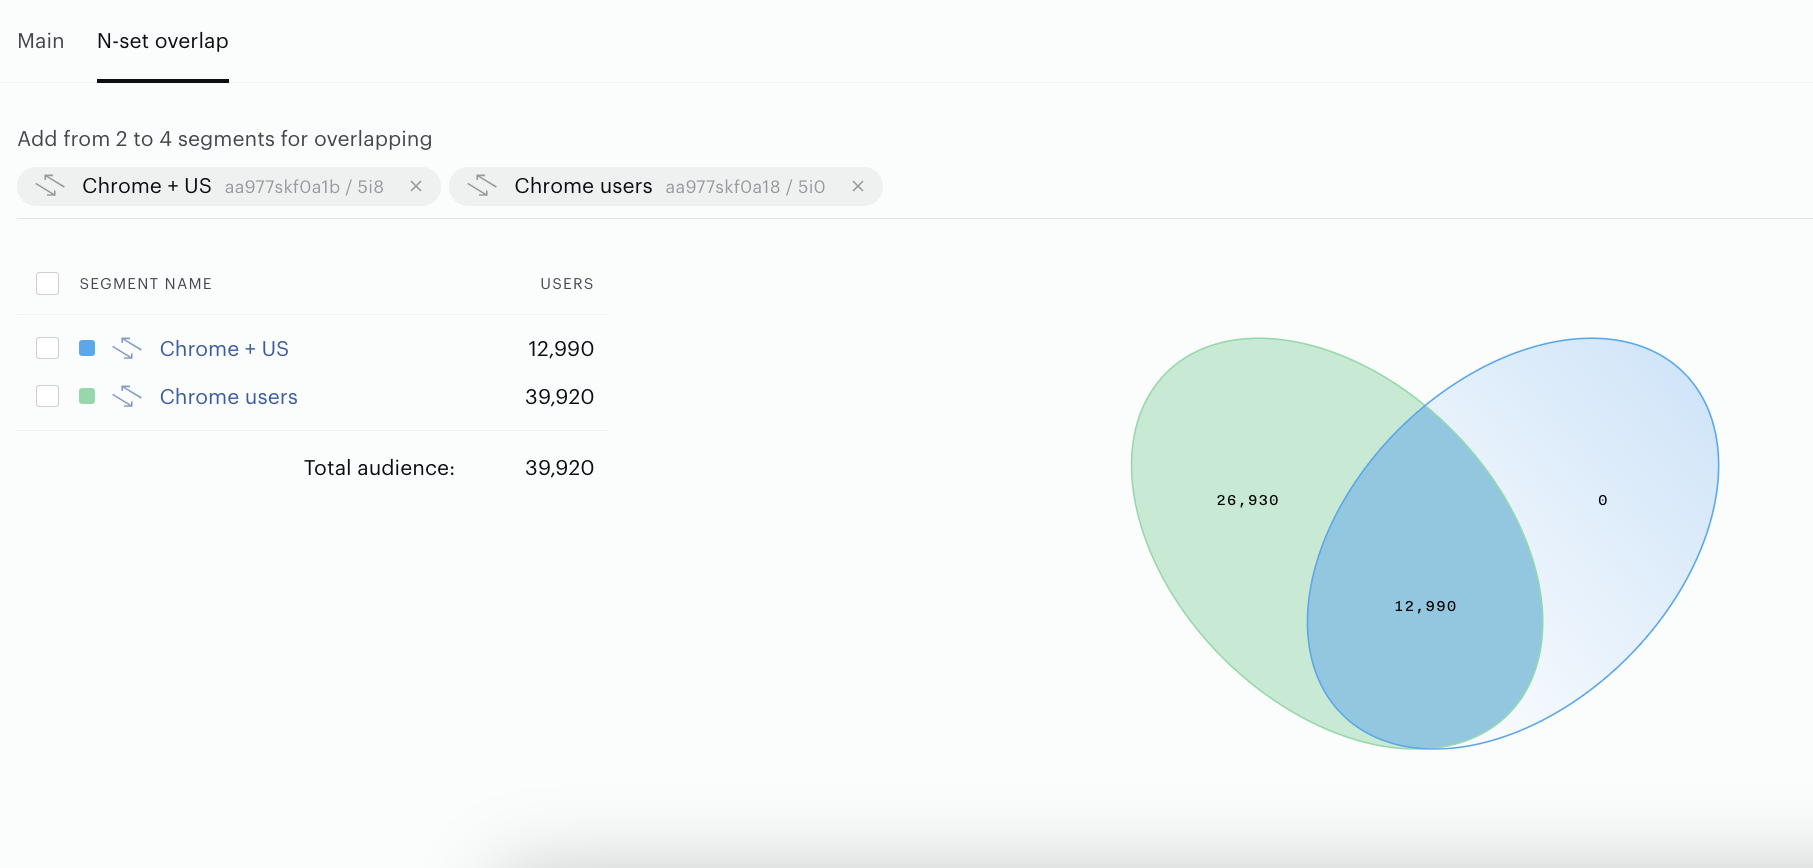
-
Click a segment name to jump to its details in the Segments page.
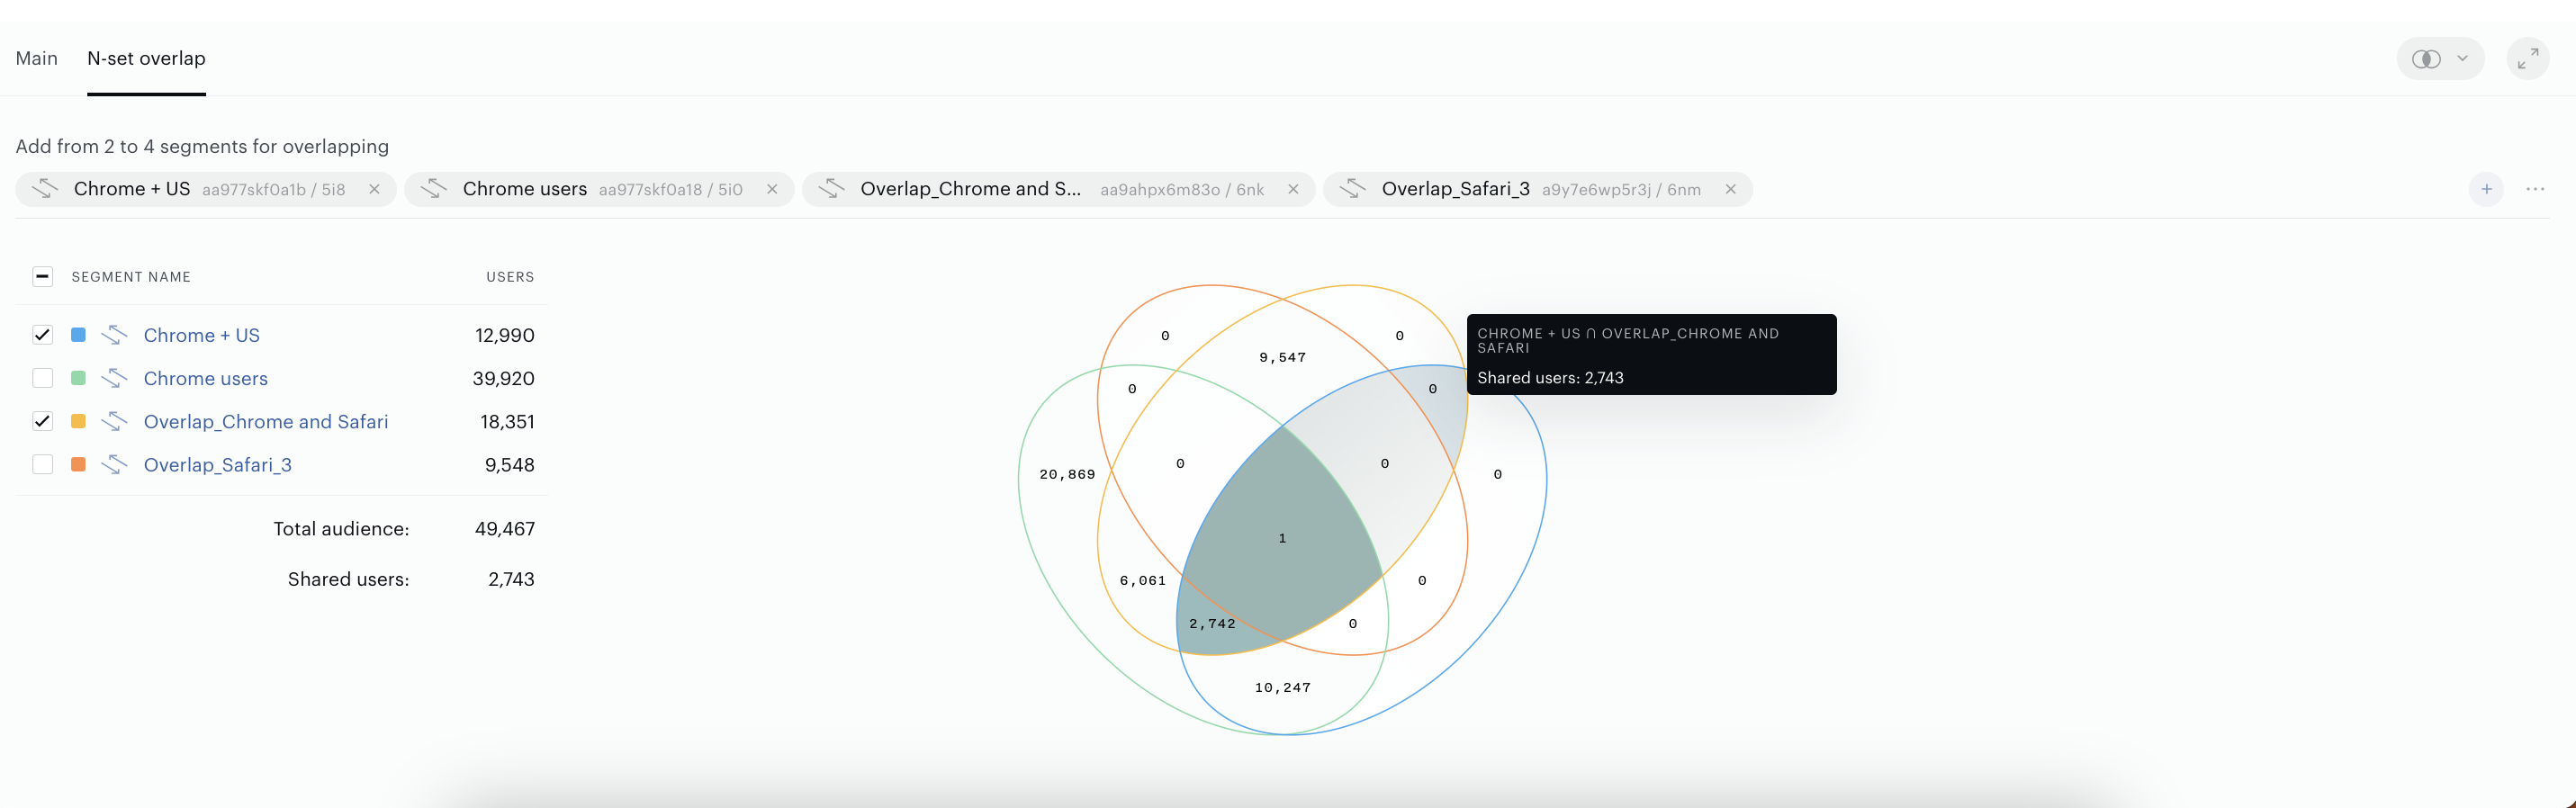
-
Select/deselect segments to focus on specific combinations. An adjacent table lists shared user/URL counts for visible subsets. Perfect for understanding multi-segment relationships at a glance (max 4 due to visual complexity).
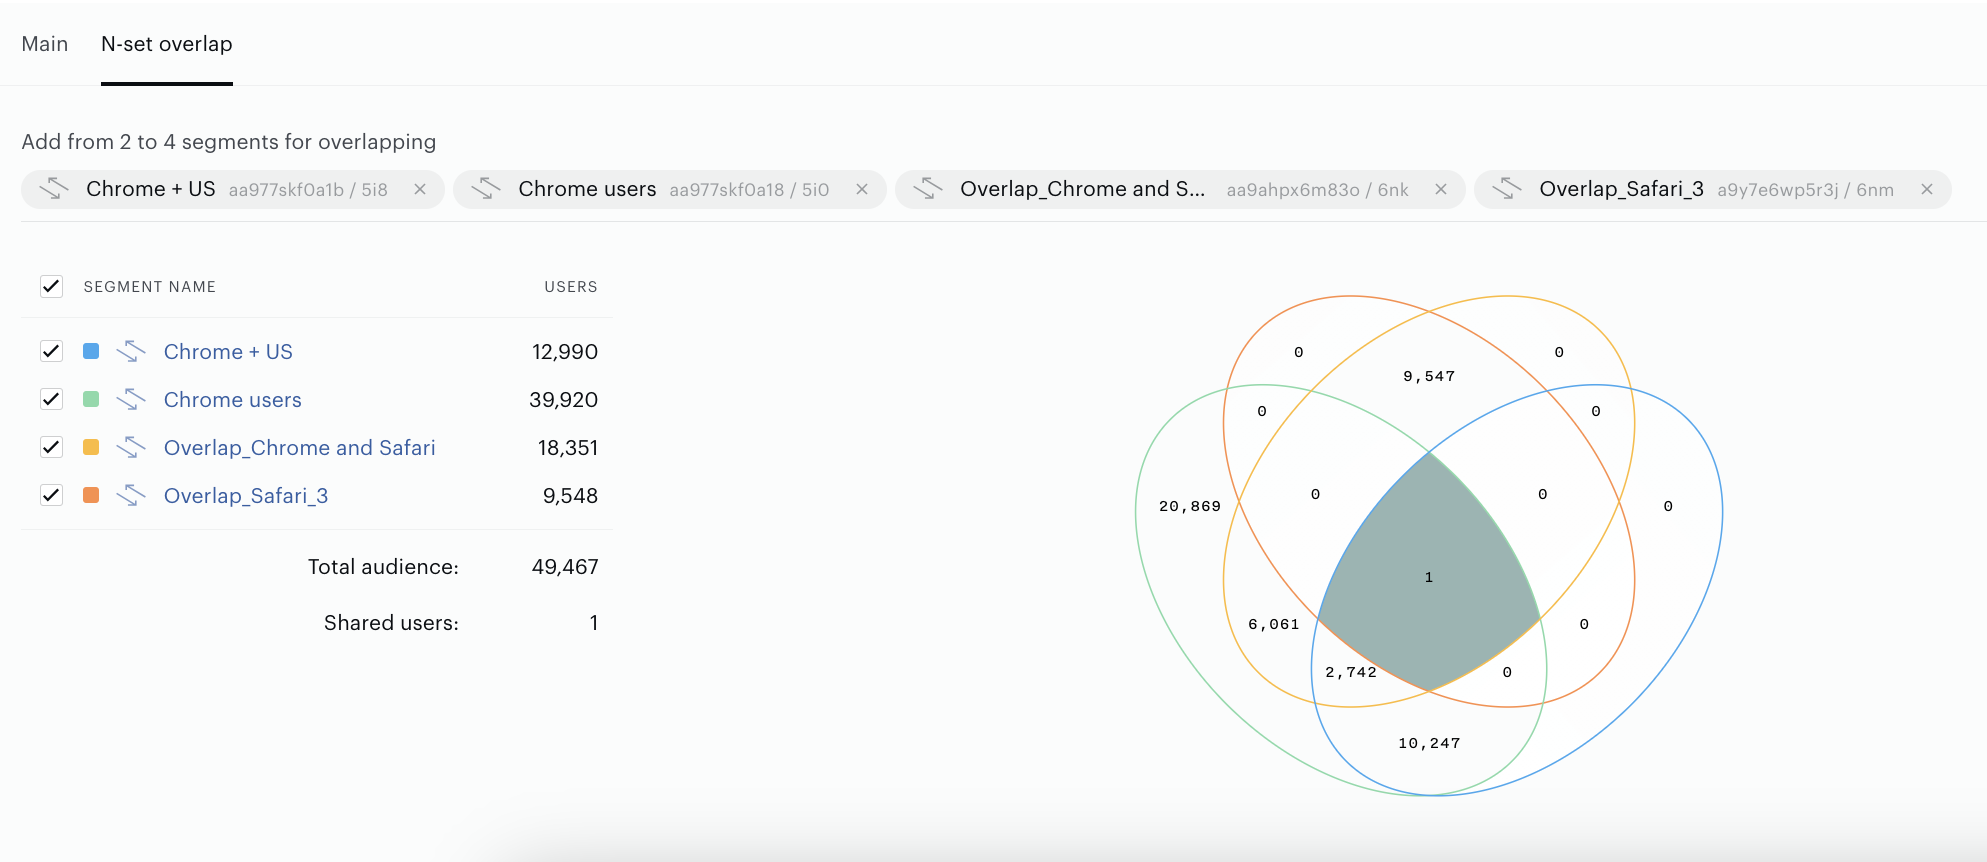
Table diagram (up to 10 segments)
Table diagram works with a maximum of 10 segments. You can select 2, 3 or more segments at the same time.
To open the Table diagram go to the N-set diagram tab and select the Table option in the diagram selector:
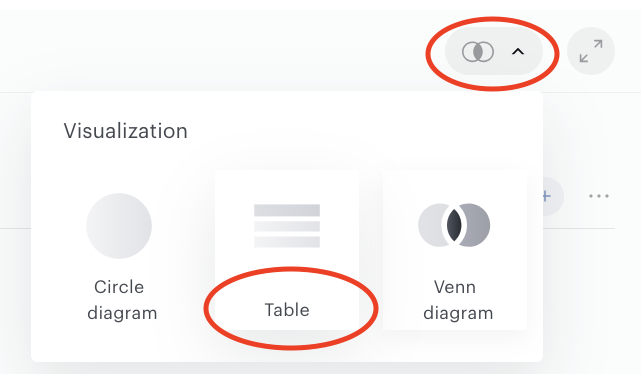
When you shift between diagrams the earlier selected segments are saved and used for new visualization.
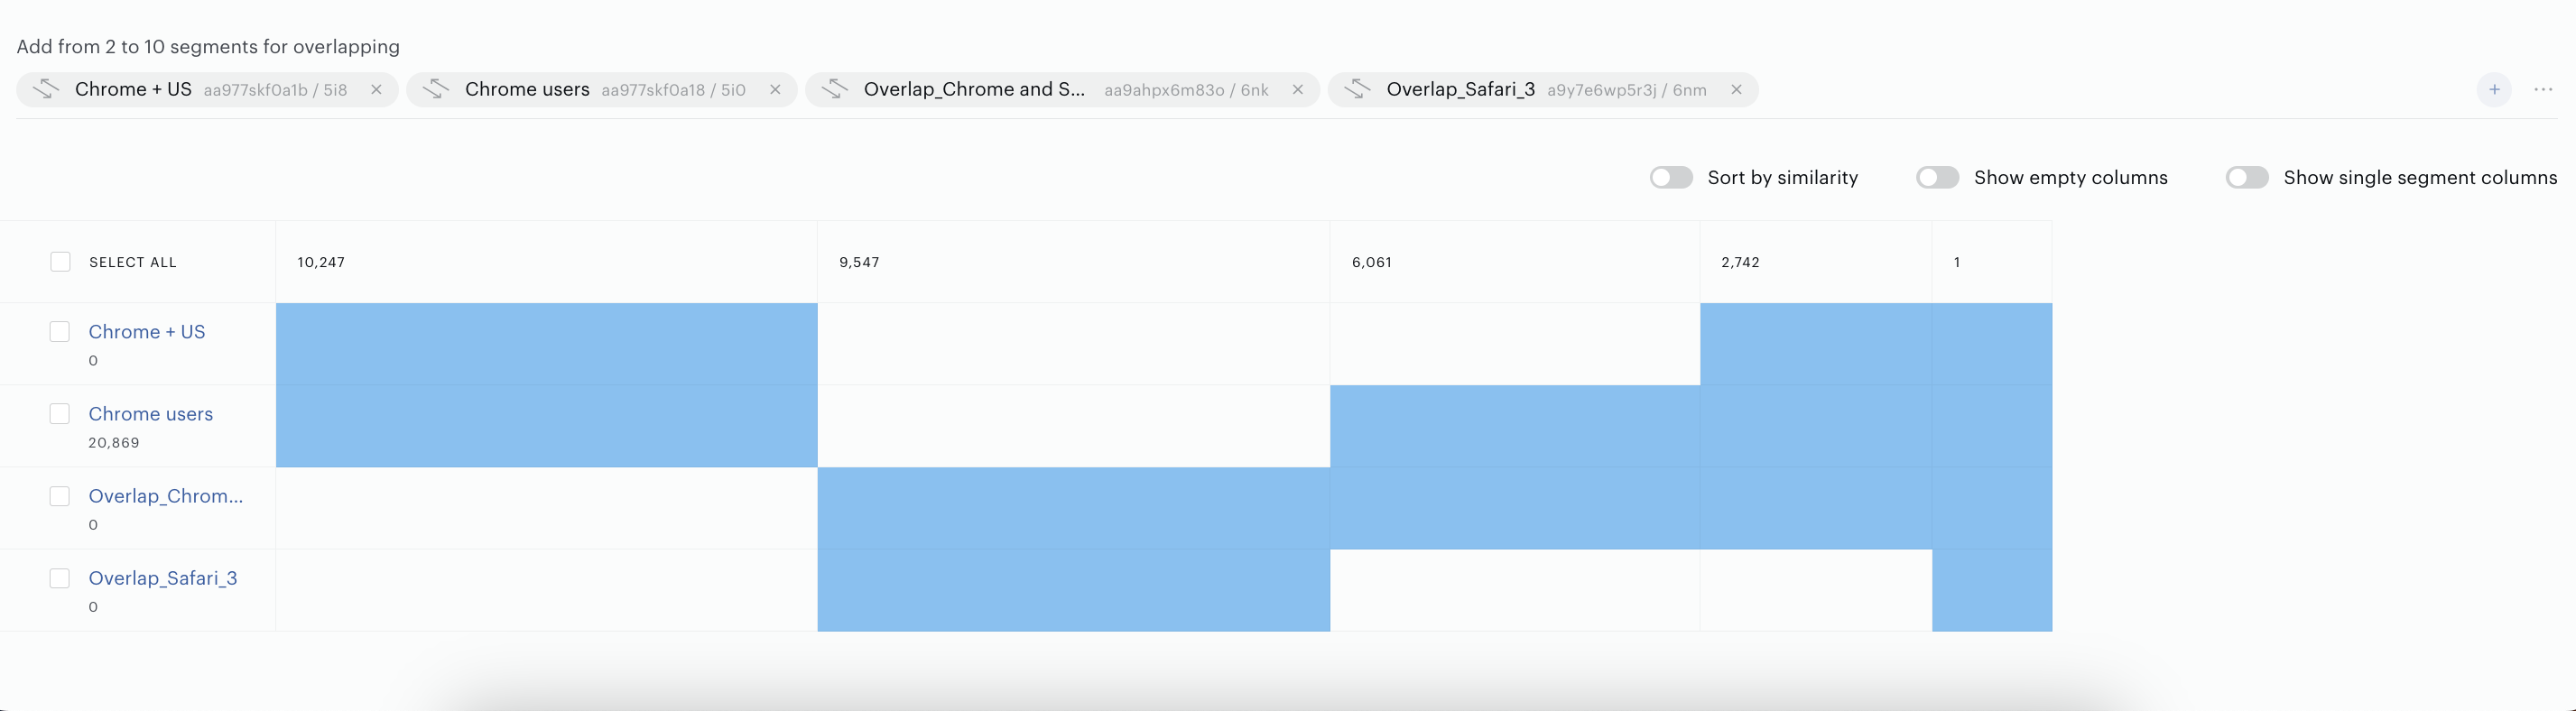
Each segment - is a set, columns in the table show the subsets (parts of the segments) and their intersections. As a result you can see all possible subsets, all possible segments intersections, including those subsets where segments do not intersect with each other.
For example, you select 4 segments:
-
A - “Chrome+US” segment
-
B - “Chrome users” segment
-
C - “Overlap_Chrome_and_…” segment
-
D - “Overlap_Safari_3” segment
In table you can see columns with all variants of intersections of the selected segments: A∩B, B∩C, C∩D, A∩C, A∩B∩C, B∩C∩D, C∩D∩A, A∩B∩C∩D… Where the symbol ∩ is used to show the intersection of segments (this is a top-level description, in reality, the algorithms are slightly more complex from a mathematical point of view, but it is not important to understand the principle of constructing a diagram).
The blue colored cells indicate that these segments (in the rows) have common (shared/overlapped) users. The numbers in the column names show the number of shared/overlapped - the same users in blue-colored cells.
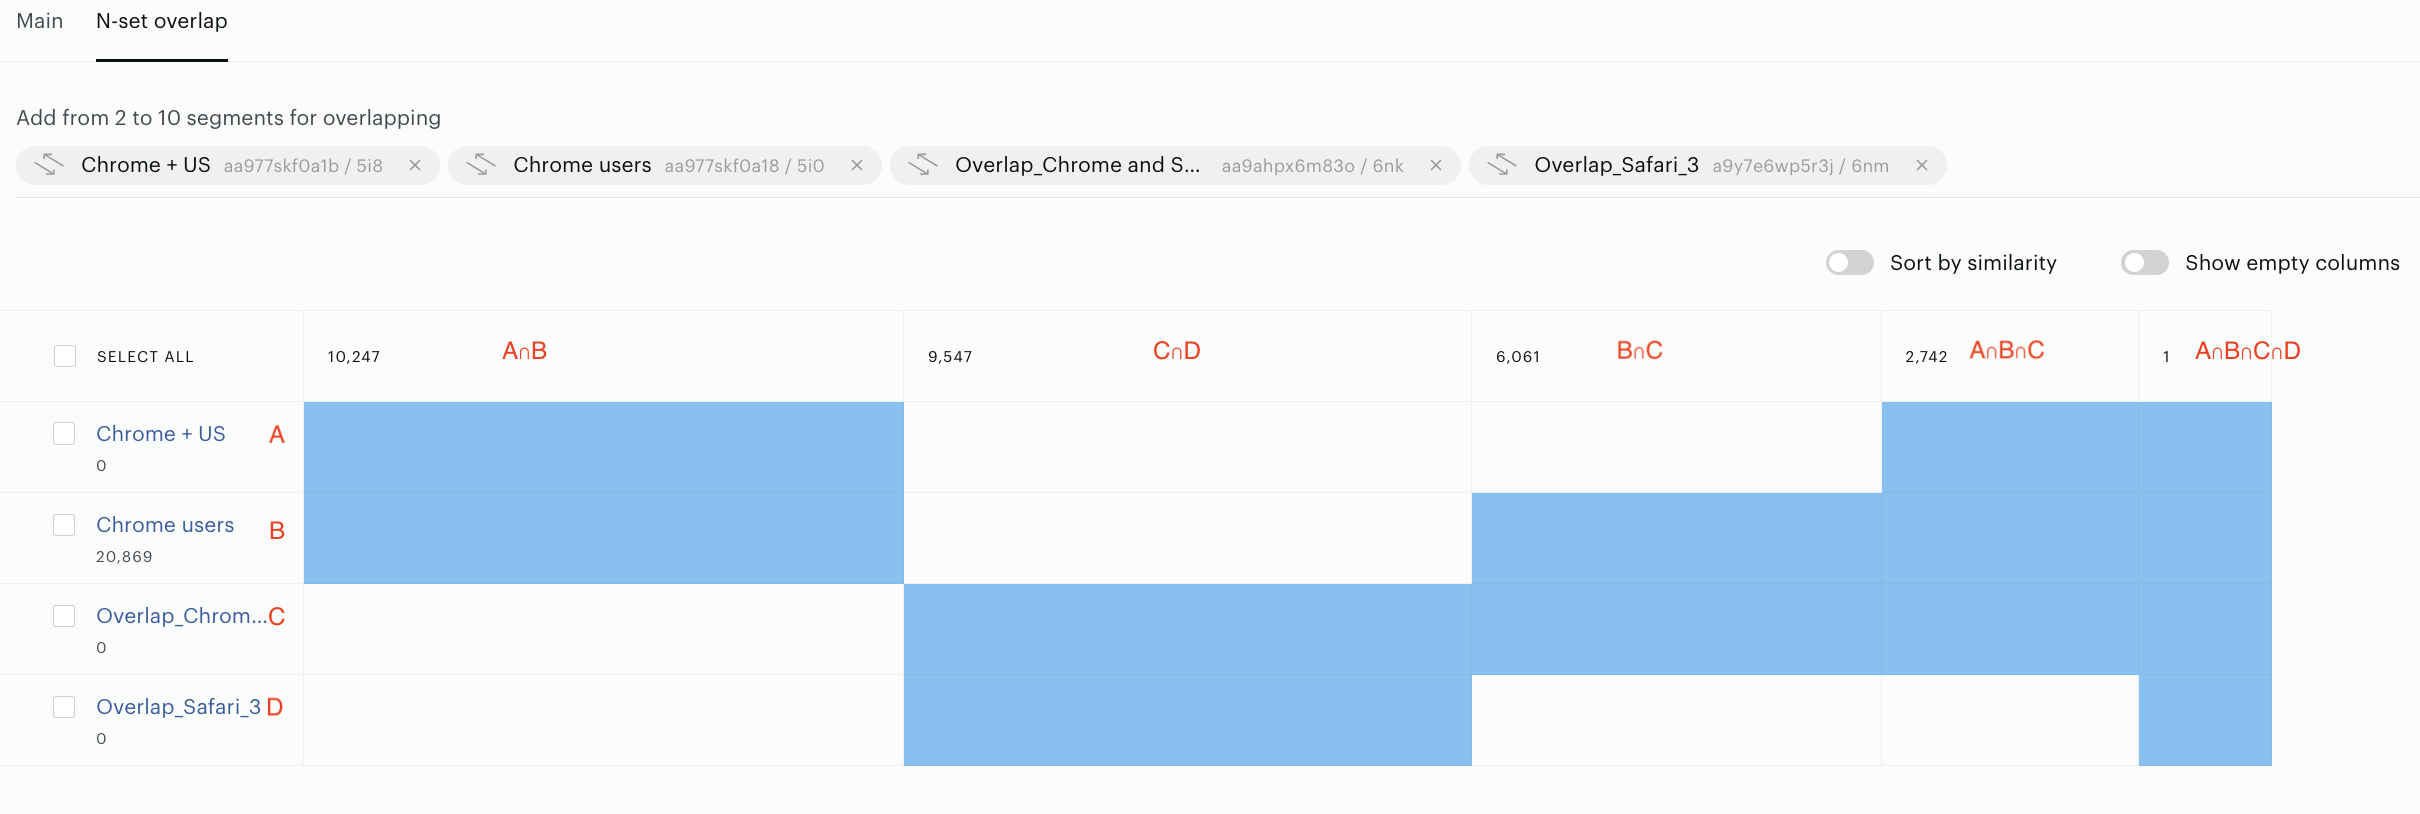
For example, in the screenshot above the right column with column name “1” and all colored cells shows that all 4 segments are overlapped and the number of common users is 1.
The column with column name “2742” shows that the first 3 segments have overlapped users and the number of common users is 2742.
By default the report doesn’t show columns with empty intersections - the subsets with 0 common users. To show them, activate the slider Show empty columns.
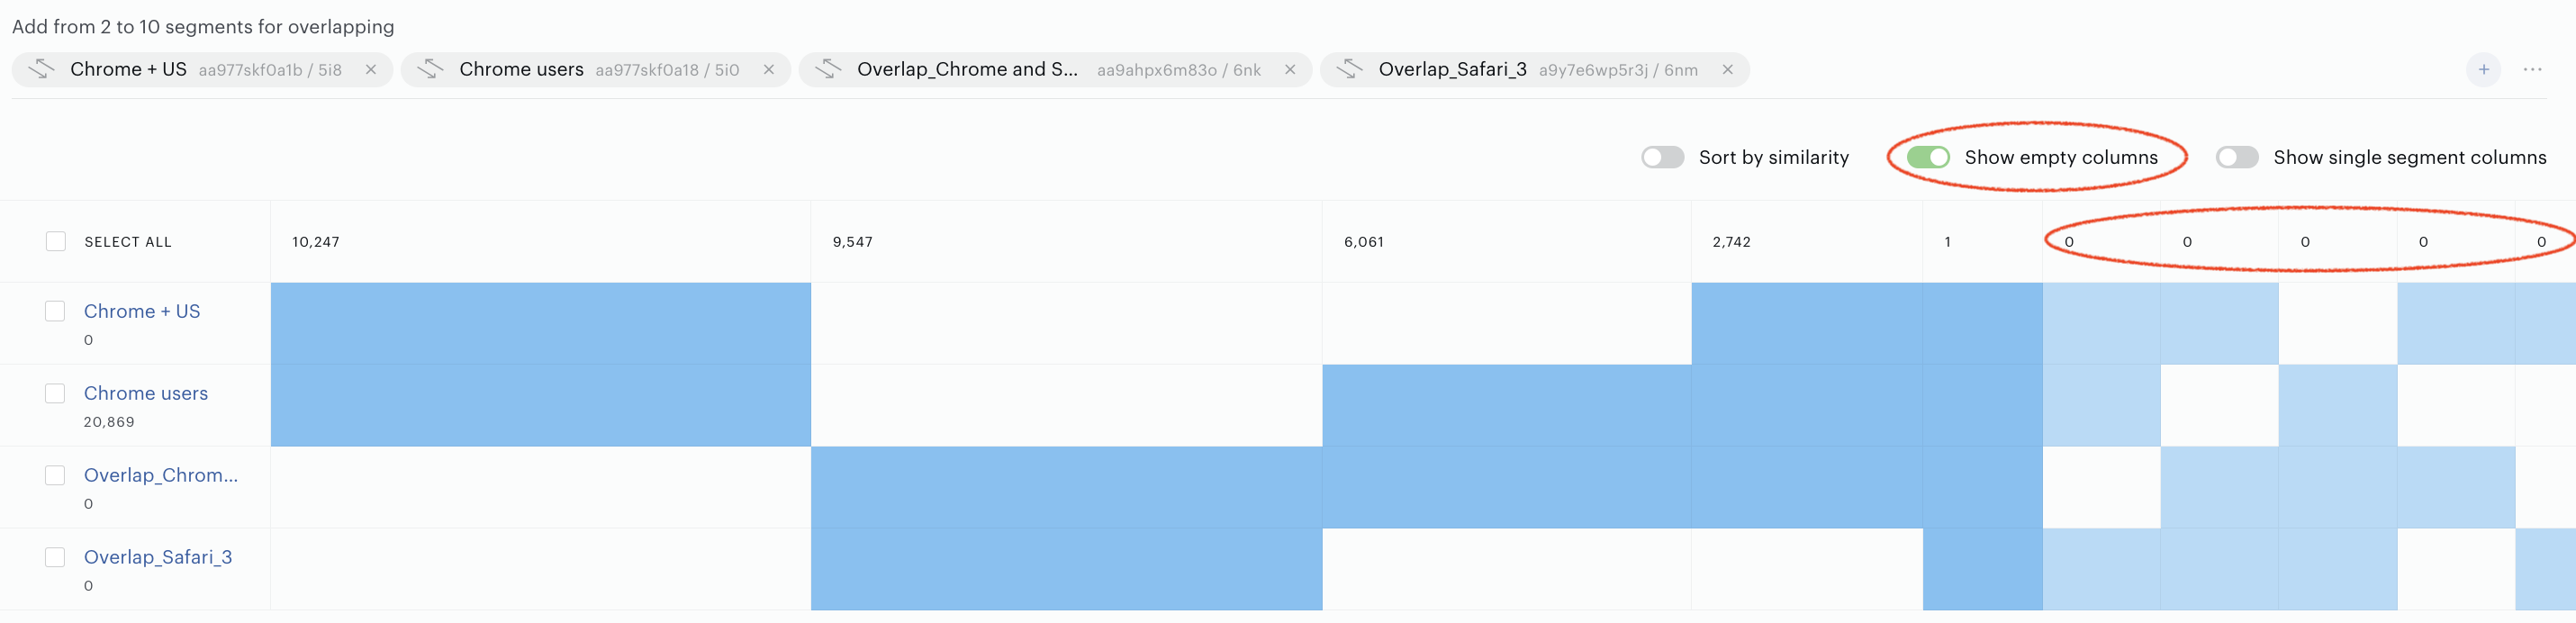
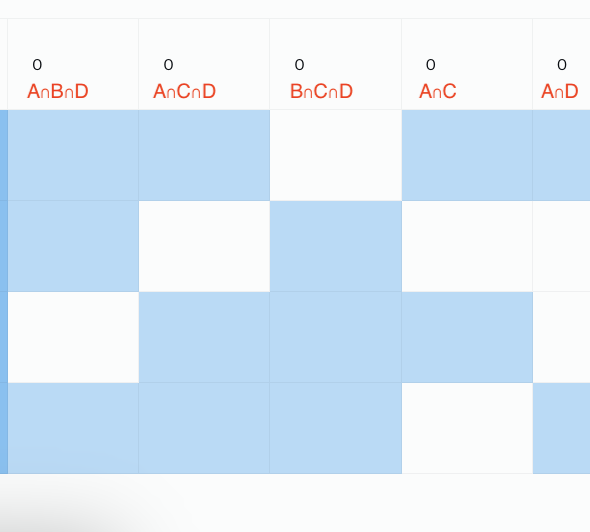
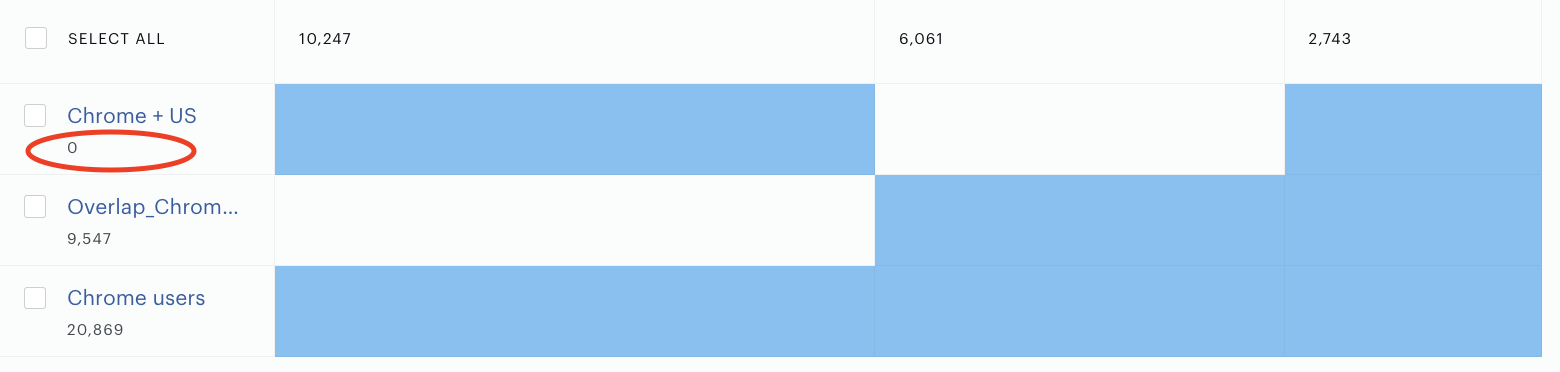
The numbers below the segment names in the first column is the number of users who do not overlap with anyone in other segments:
Working with Table diagram it is possible to select/deselect all or some of segments to see, for example, pairs of overlapped segments, data of the particular segment, or all segments:
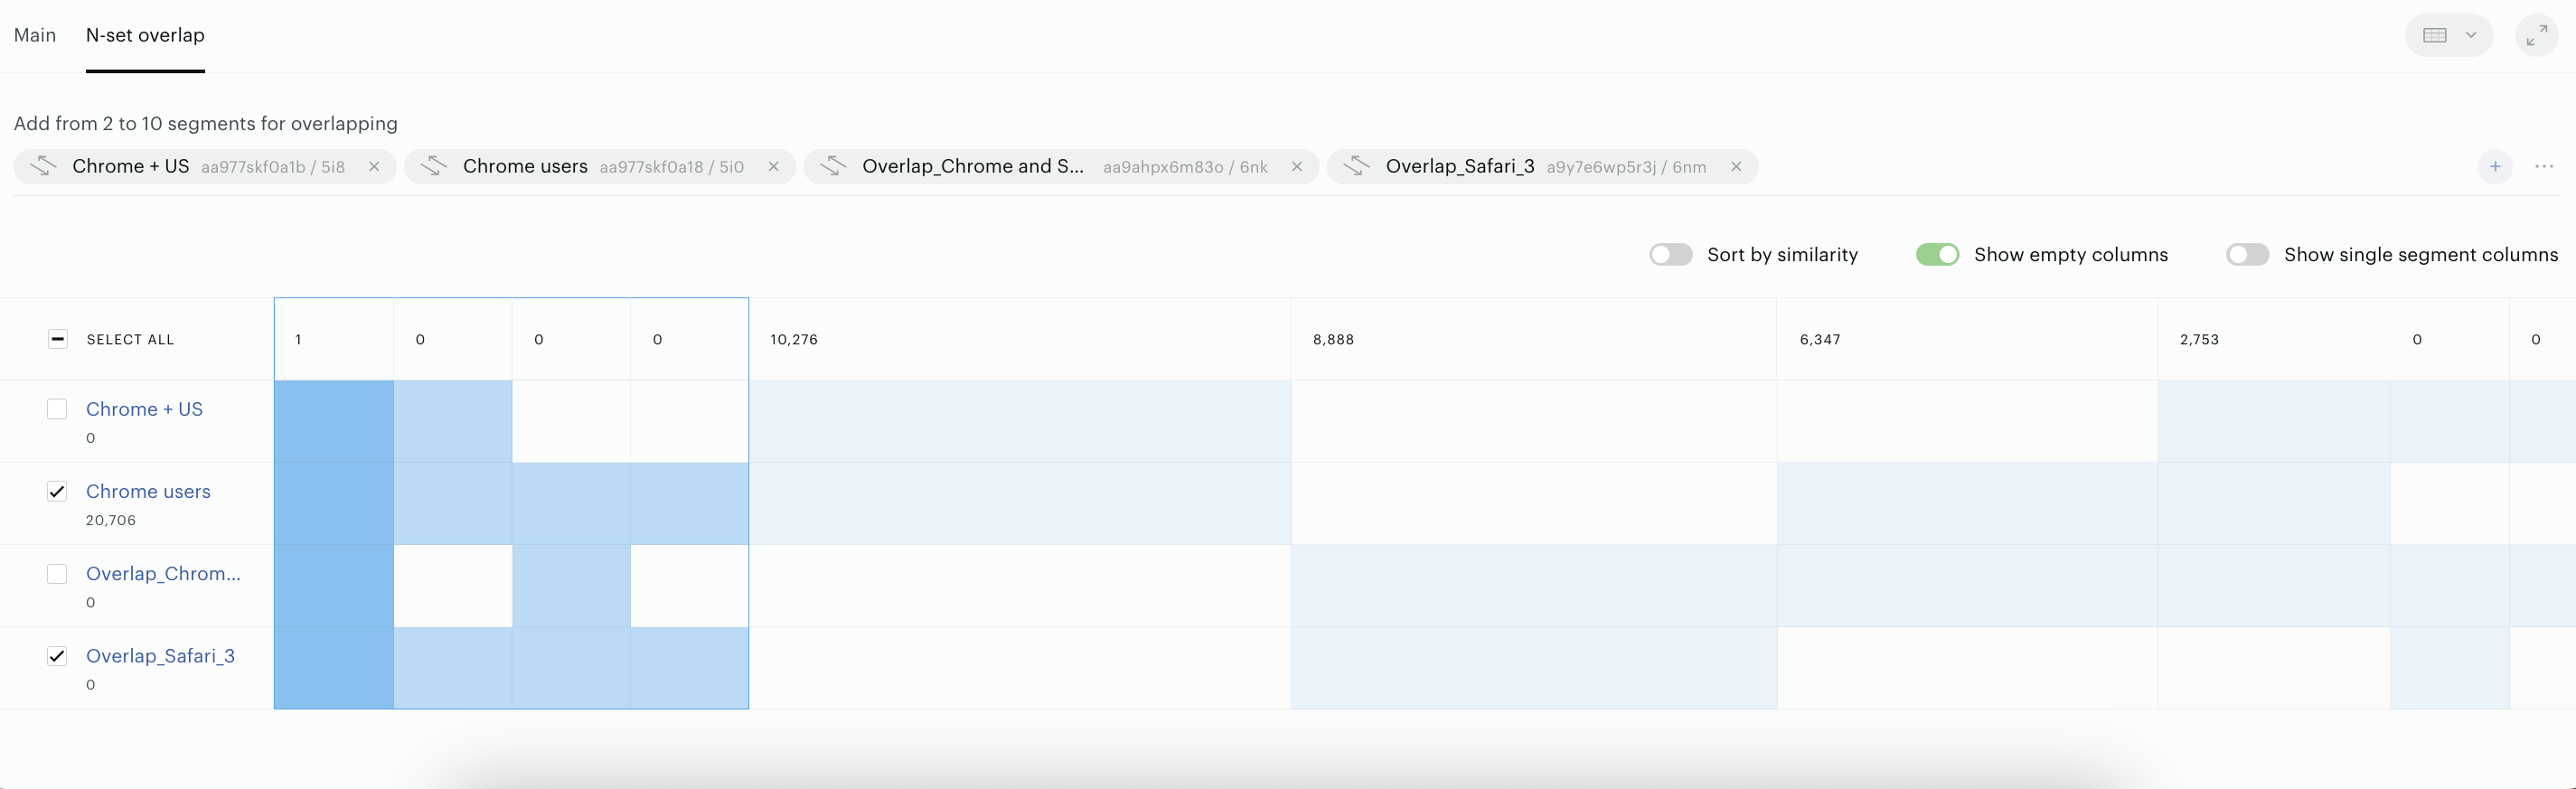
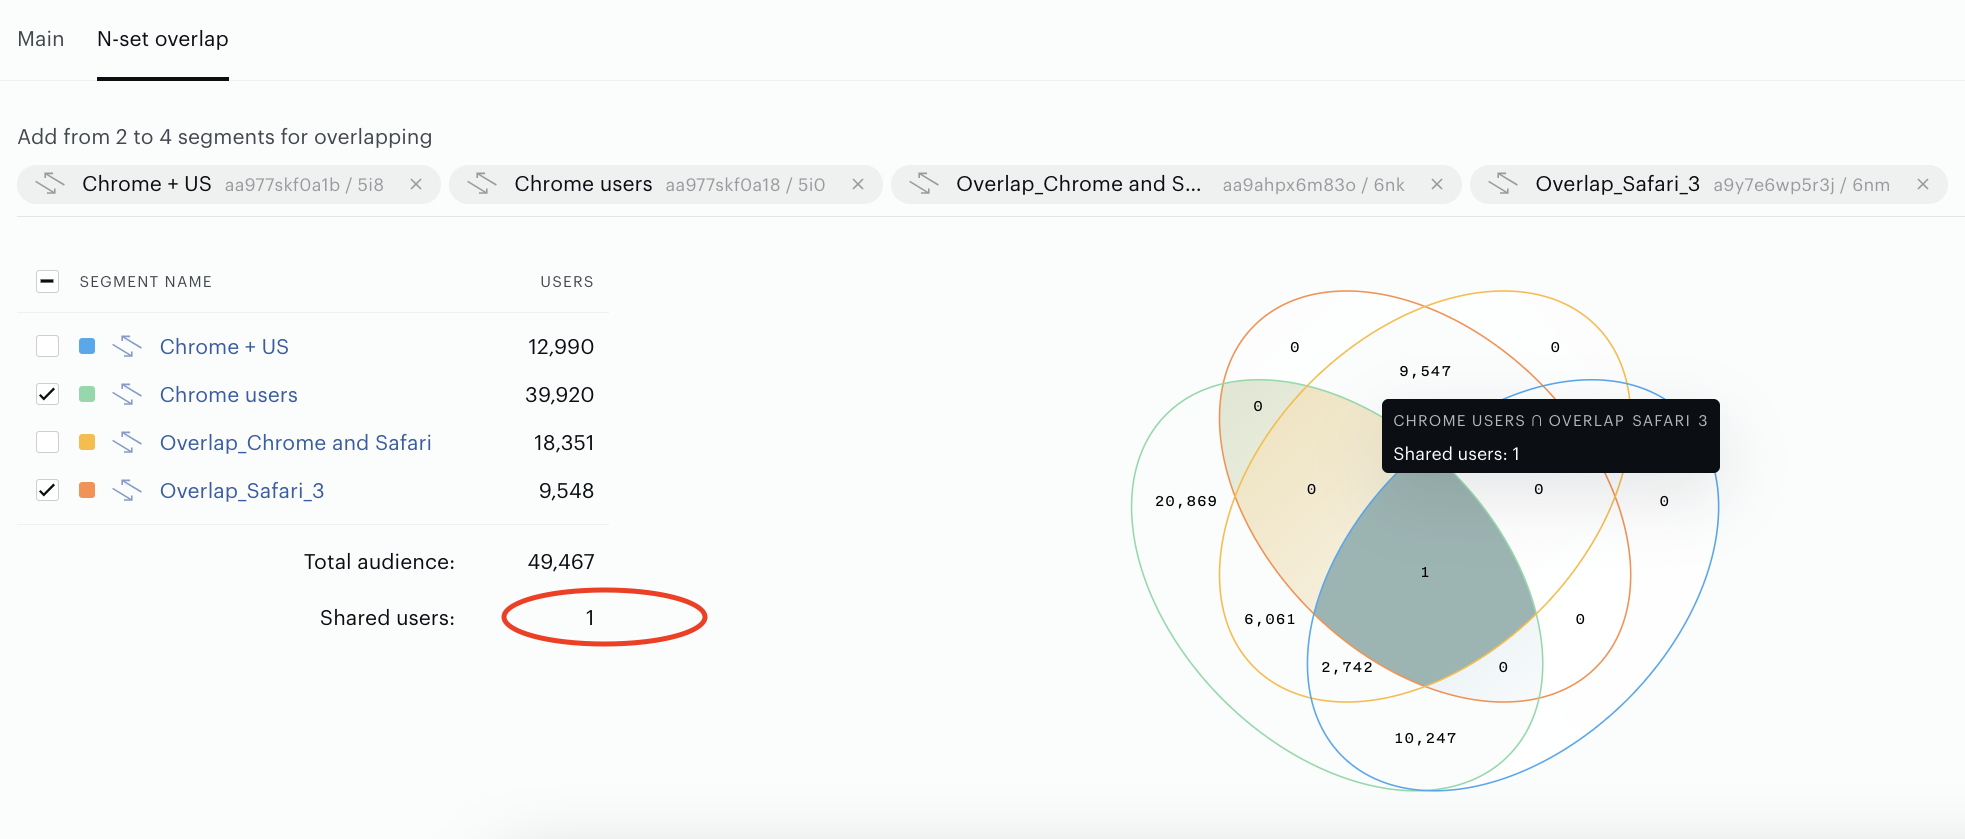
The columns shows the number of overlapped segments, in the example above the number 1 shows that 4 segments have 1 common user - the same you can see using Venn diagram, please compare:
Benefits
-
Quickly identify redundant or near-identical segments
-
Confirm zero-overlap segments for exclusive targeting
-
Optimize campaigns by focusing on unique users (User segments) or unique content/URLs (Contextual segments)
-
Visualize complex multi-segment relationships more intuitively
Notes & Limitations
-
Data refresh cadence: Main view ≈ daily; N-set views ≈ every 1–2 hours (check the “Last updated” timestamp). For real-time overlap checks while building a segment, use the Overlaps tab inside the Segment Builder (see links below).
-
Download/export is currently unavailable in this report view.
-
Managed segments or unexpected behavior: contact your Account Manager or support team.