
Reach for User segments
Reach report explains the audience share actually represented by a segment in terms of both the percentage within the site group and the actual size of the segment.
For example, with a site group that has a recent audience of one million users, a segment representing "potential car buyers in London" can have a 30% reach (or 300,000 audience members within the site group).
To open the Reach report for the User segments, go to the Audience→Reporting→Reach and after that select the User segments tab. Choose a site group in the top right selector.
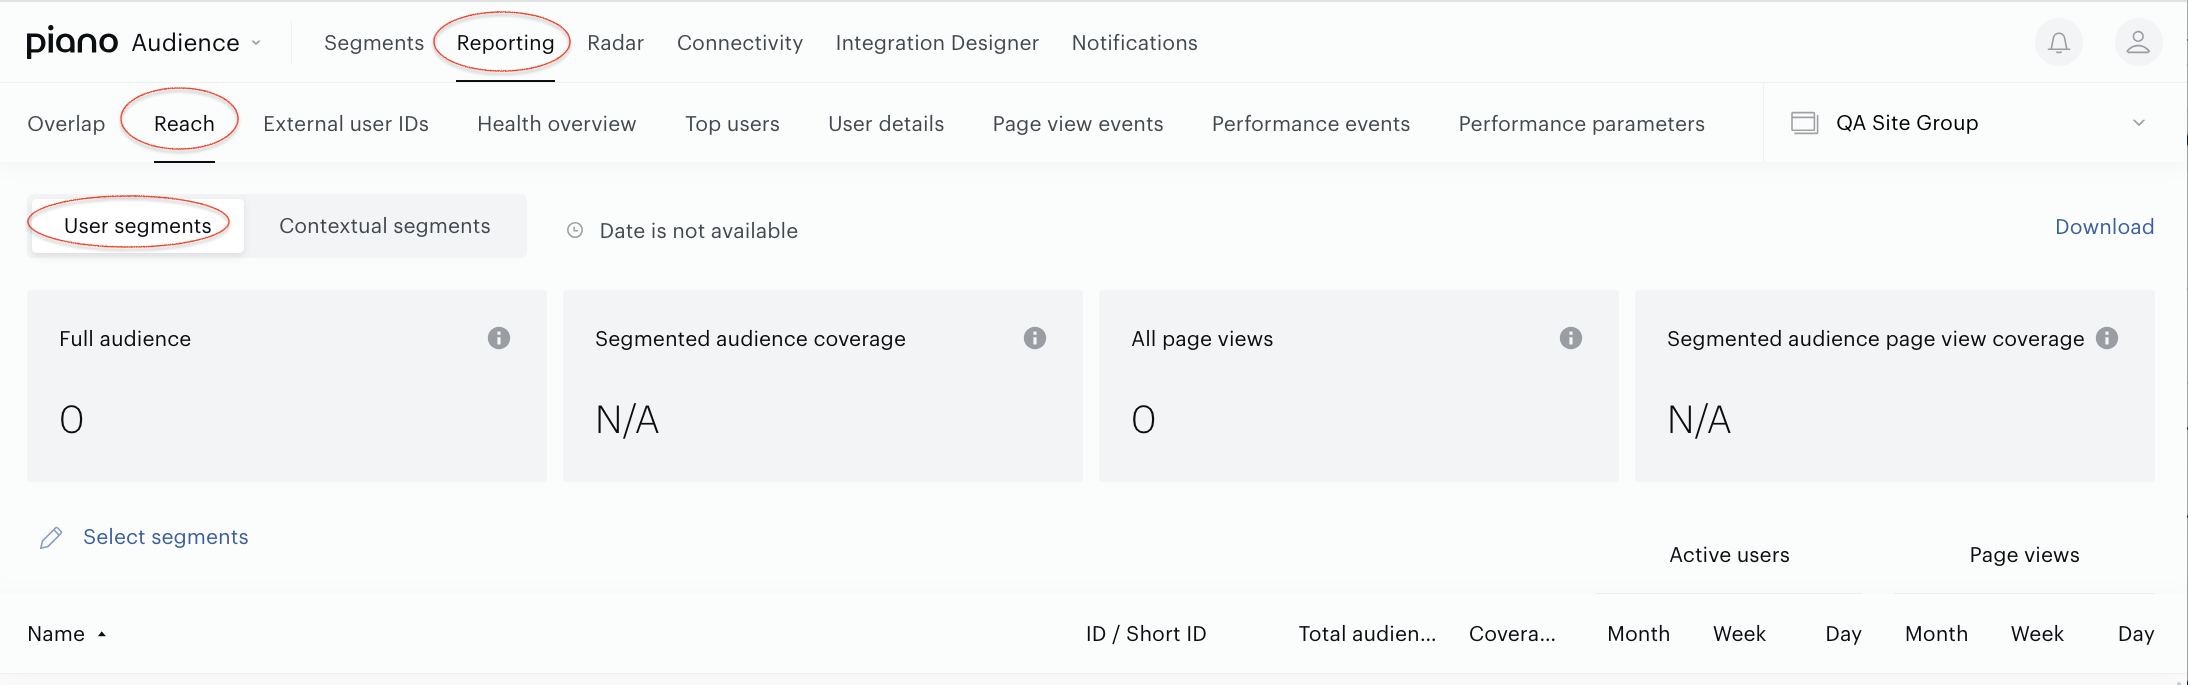
The Reach report consists of two main parts: summary section and table view.
Summary
At the top of the page, there are four summary boxes observing all the segments in the table.
-
Full audience: the total number of end users in this site group over the last 30 days (or 90 days if provided for by your LTS).
-
Segmented audience coverage: the total number and percentage of the end users belonging to one or more segments.
-
All page views: the total number of pageviews in this site group over the last 30 days (or 90 days if provided for by your LTS).
-
Segmented audience page view coverage: the total number and percentage of the page views by the users belonging to one or more segments.

Table view
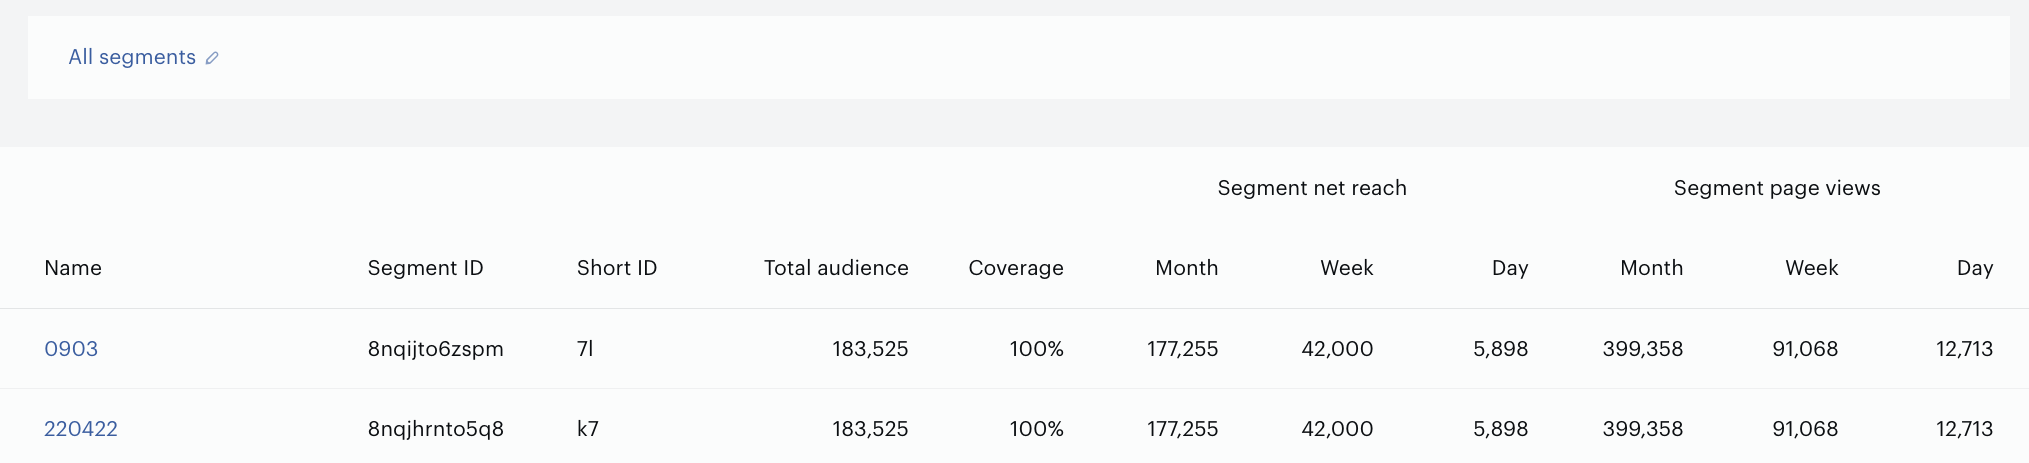
The table rows hold segments while columns stand for the following parameters:
-
name,
-
ID/Short ID,
-
total audience,
-
coverage (%),
-
segment net reach,
-
segment page views.
Segment net reach indicates how many users the segment contained last month (or week, or day).
Segment page views indicate how many page views were generated by a certain segment last month (or week, or day).
To sort segments by one of the parameters, click the parameter name (column name).
Reach for Contextual segments
To open the Reach report for the Contextual segments, go to the Audience→Reporting→Reach and after that select the Contextual segments tab. Choose a site group in the top right selector.
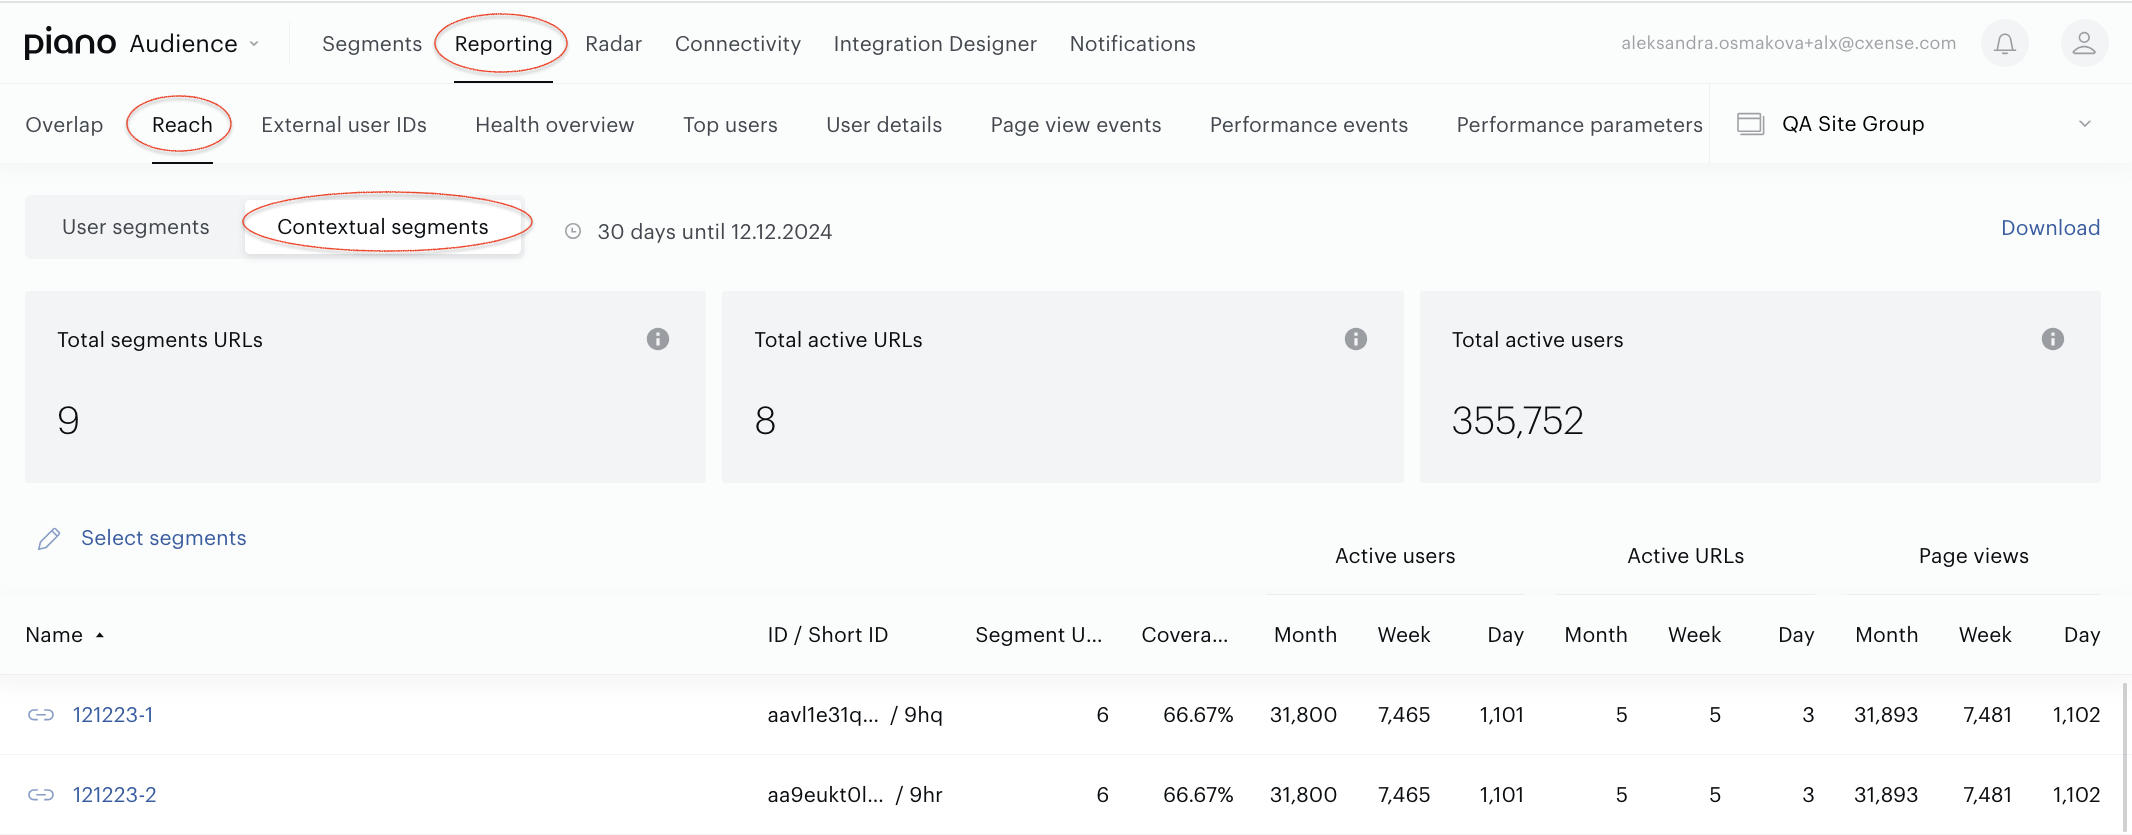
The Reach report for Contextual segments consists of two main parts: summary section and table view.
Summary
At the top of the page, there are four summary boxes observing all the segments in the table.
-
Total segments URLs: all pages linked to the segments whether they have seen traffic or not.
-
Total active users: All users that have been visiting the segmented pages.
-
Total active URLs: All pages that are linked to the segments and have seen traffic within the last 24 hours. At the moment this metric is not available.
The metrics are calculated based on data of the current site group over the last 30 days (or 90 days if it is provided by your LTS).

Table view
The table rows hold segments while columns stand for the following parameters:
-
name,
-
ID/Short ID,
-
segment URLs,
-
coverage (%),
-
active users,
-
active URLs (at the moment this metric is not available),
-
page views.
Active users[/bolder] indicates how many users the segment contained last month (or week, or day).
[bolder]Active URLs indicate how many URLs with any traffic the segment contained last month (or week, or day).
Page views indicate how many page views were generated by a certain segment last month (or week, or day).

To sort segments by one of the parameters, click the parameter name (column name).
Segments selection
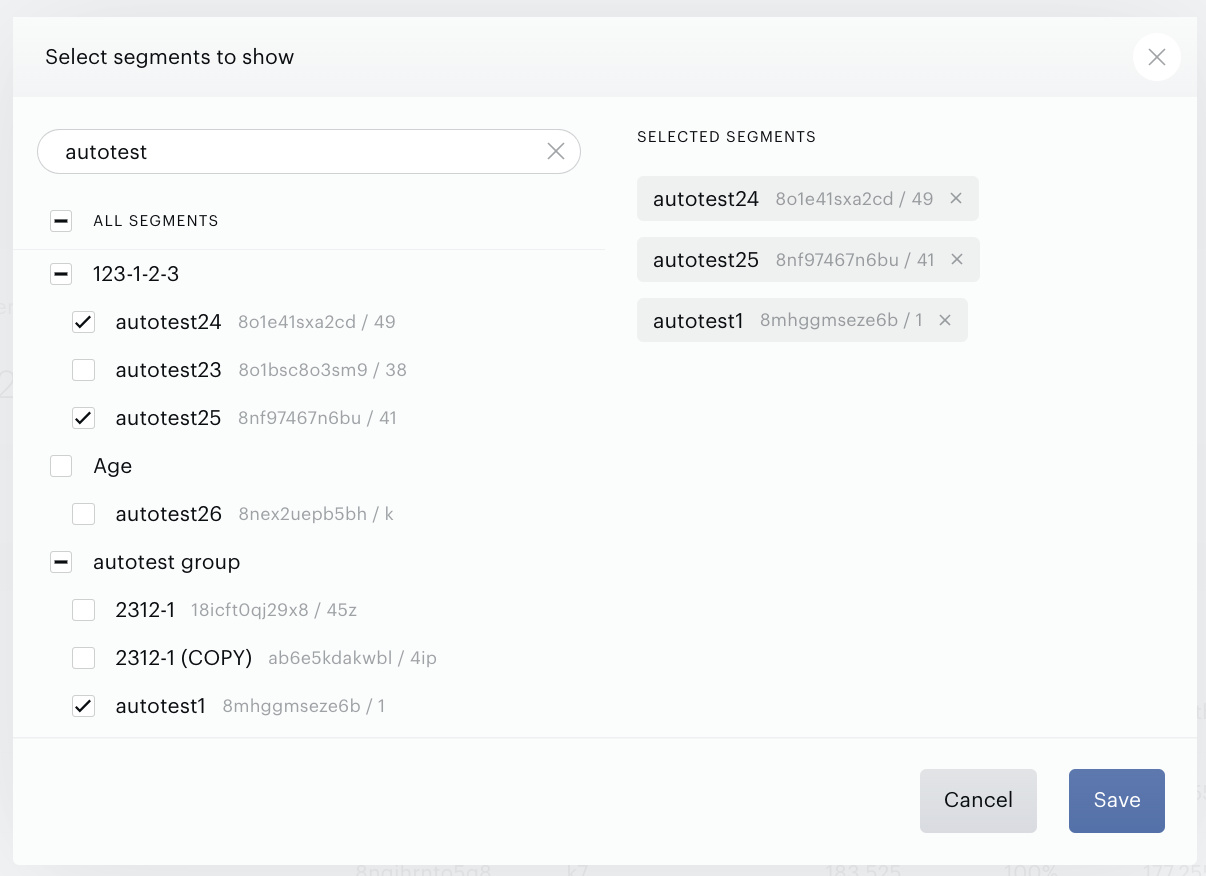
To open the segment selection menu of the Reach report, click the All segments button.
Select the segments you need or just check Select all; click Save.
Download
You can download your Reach report in a .xlsx file by clicking the Download button at the right of the report interface.