General
Through Reporting→Users, Piano Audience opens two reports: Top users and User details.
Top users provides visual representation of the amount of events recorded for both registered (Known) users and unknown (Anonymous) users on the chosen site over a selected period of time.
User details uncovers the events registered for a particular user.
Both reports offer the following filtering options:
-
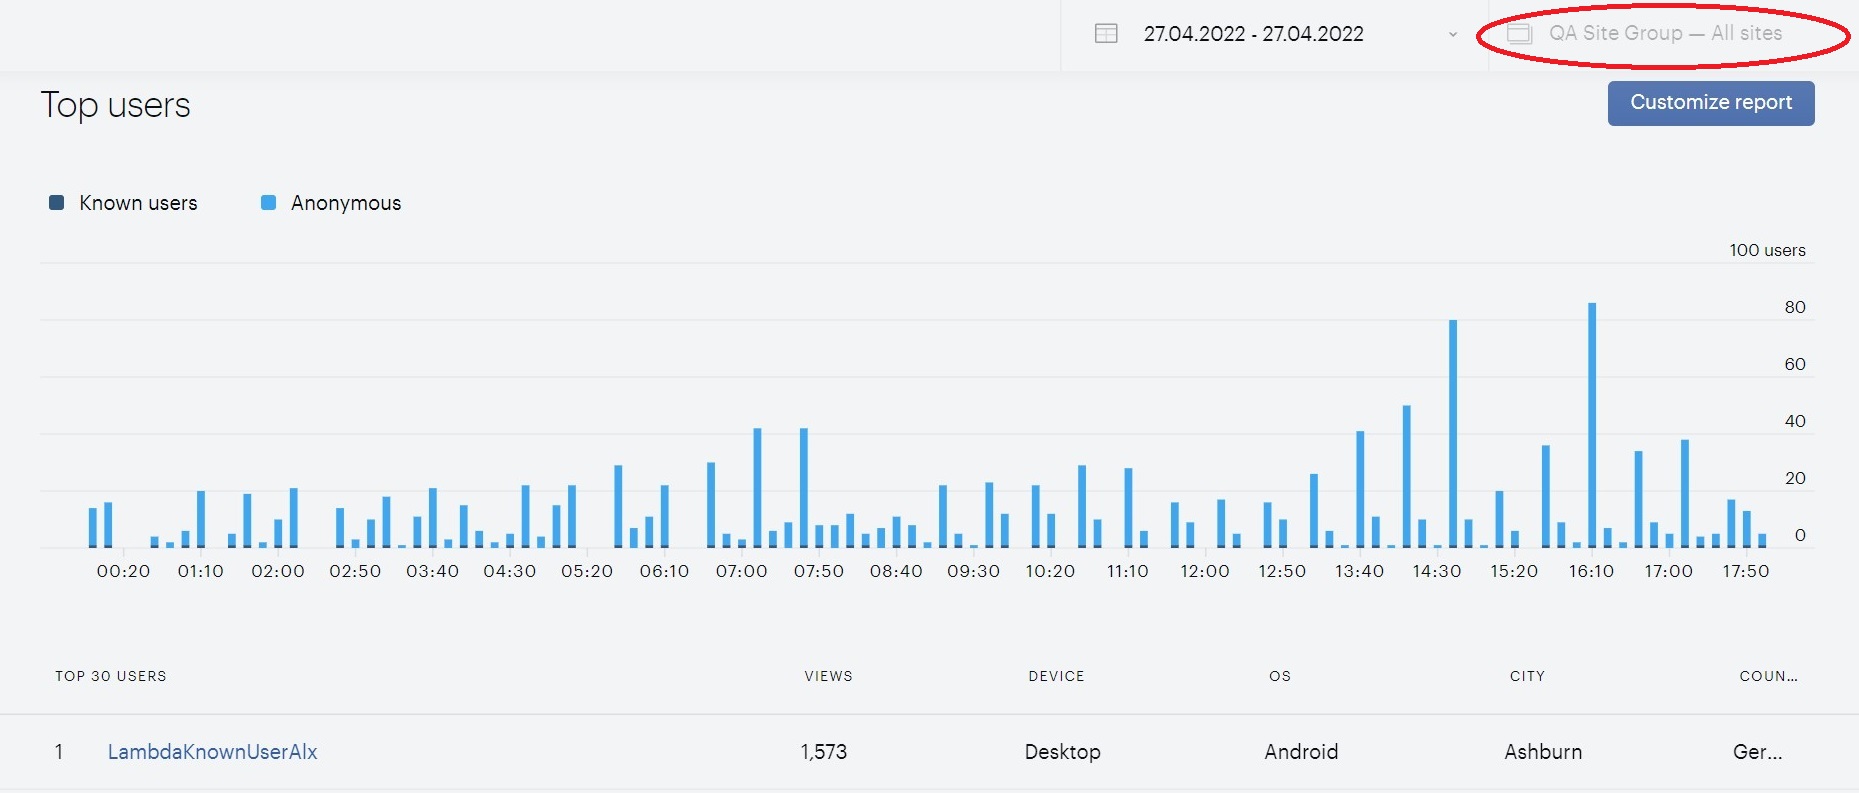
Site filter: requires selecting a single site (there is no option to select multiple sites) or all sites of the current site group.
-
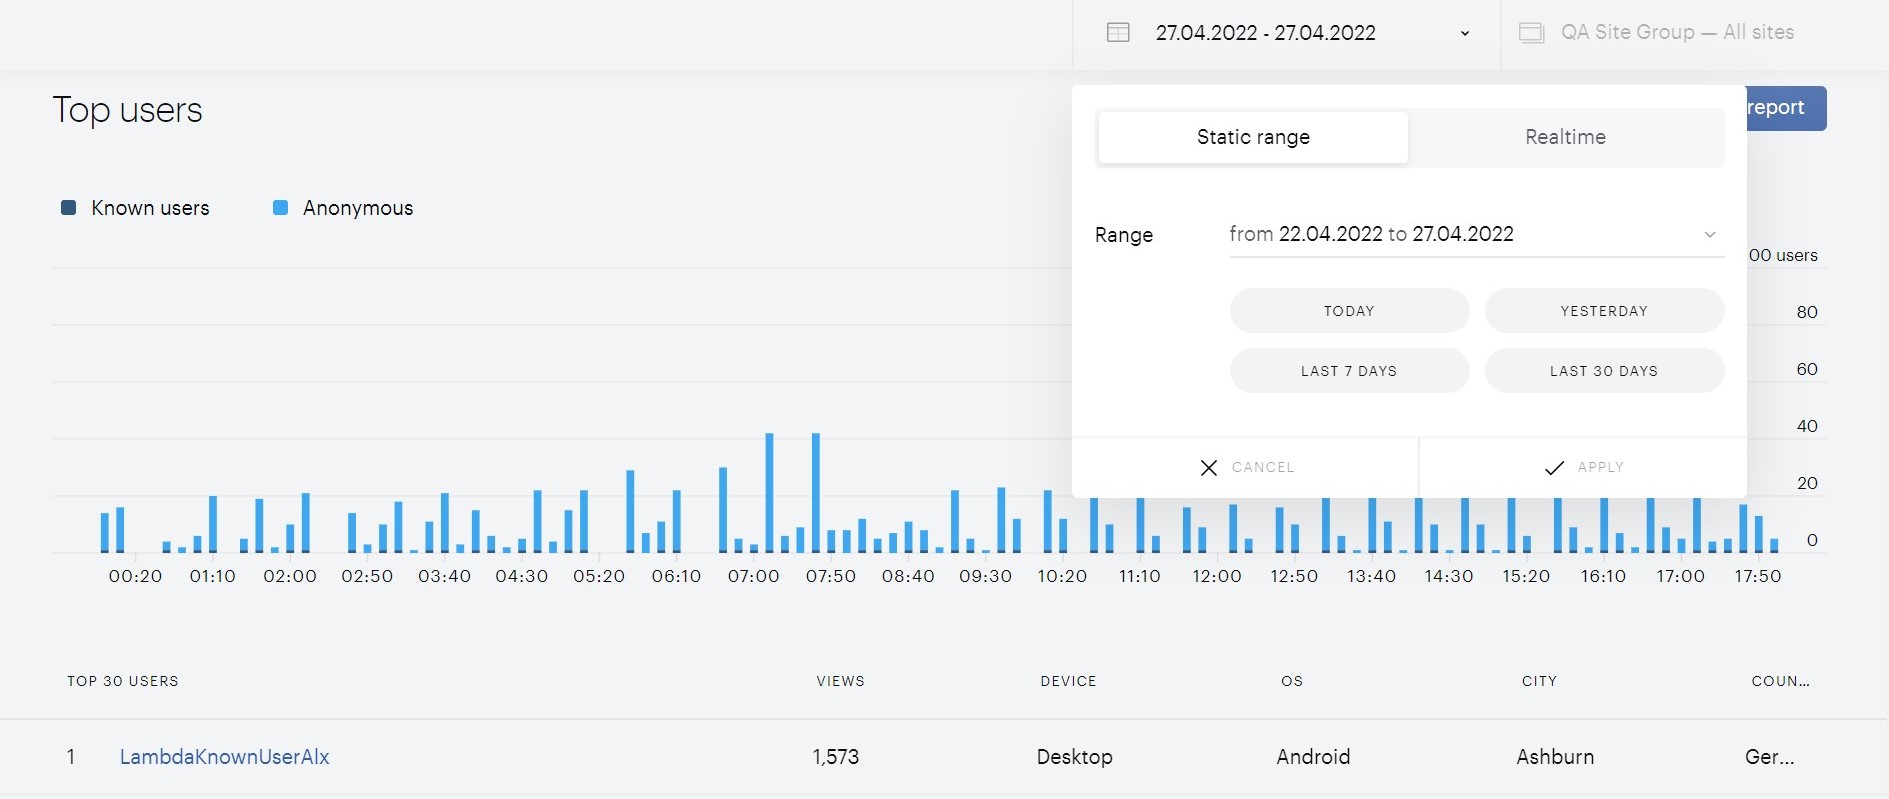
Period filter: helps the customer define the timeframe for the data shown in the report (either default or custom interval).
-
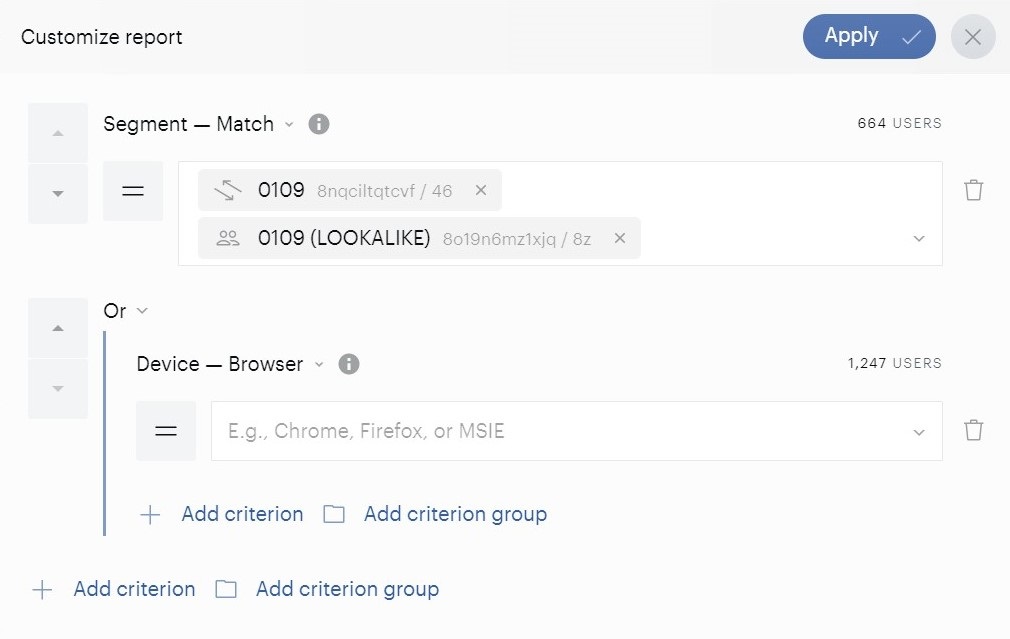
Customize report: a filter panel with a list of criteria including Event original , can be used for filtering the events. The filter panel can be opened by pressing the Customize report button. The customer can add a criterion or/and a criterion group and then apply settings to get filtered data. A criterion group can include an additional criterion or/and a criterion group.
Top users
The Top users report shows the events registered for a selected site over a specified period.
"Known user" is a user that is linked to an external ID of a type equal to the prefix belonging to a selected siteGroup. A "Known user" is a user that the customer can build by uploading 1st-party data. This again allows segmentation on things like address, age, gender, or subscription type.
If no filters are set, the graph shows all events. Сustomer can also hide data from the graph and view the dynamics for only known or only anonymous users - just click the icons in the legend above the chart area to show/hide the rows. 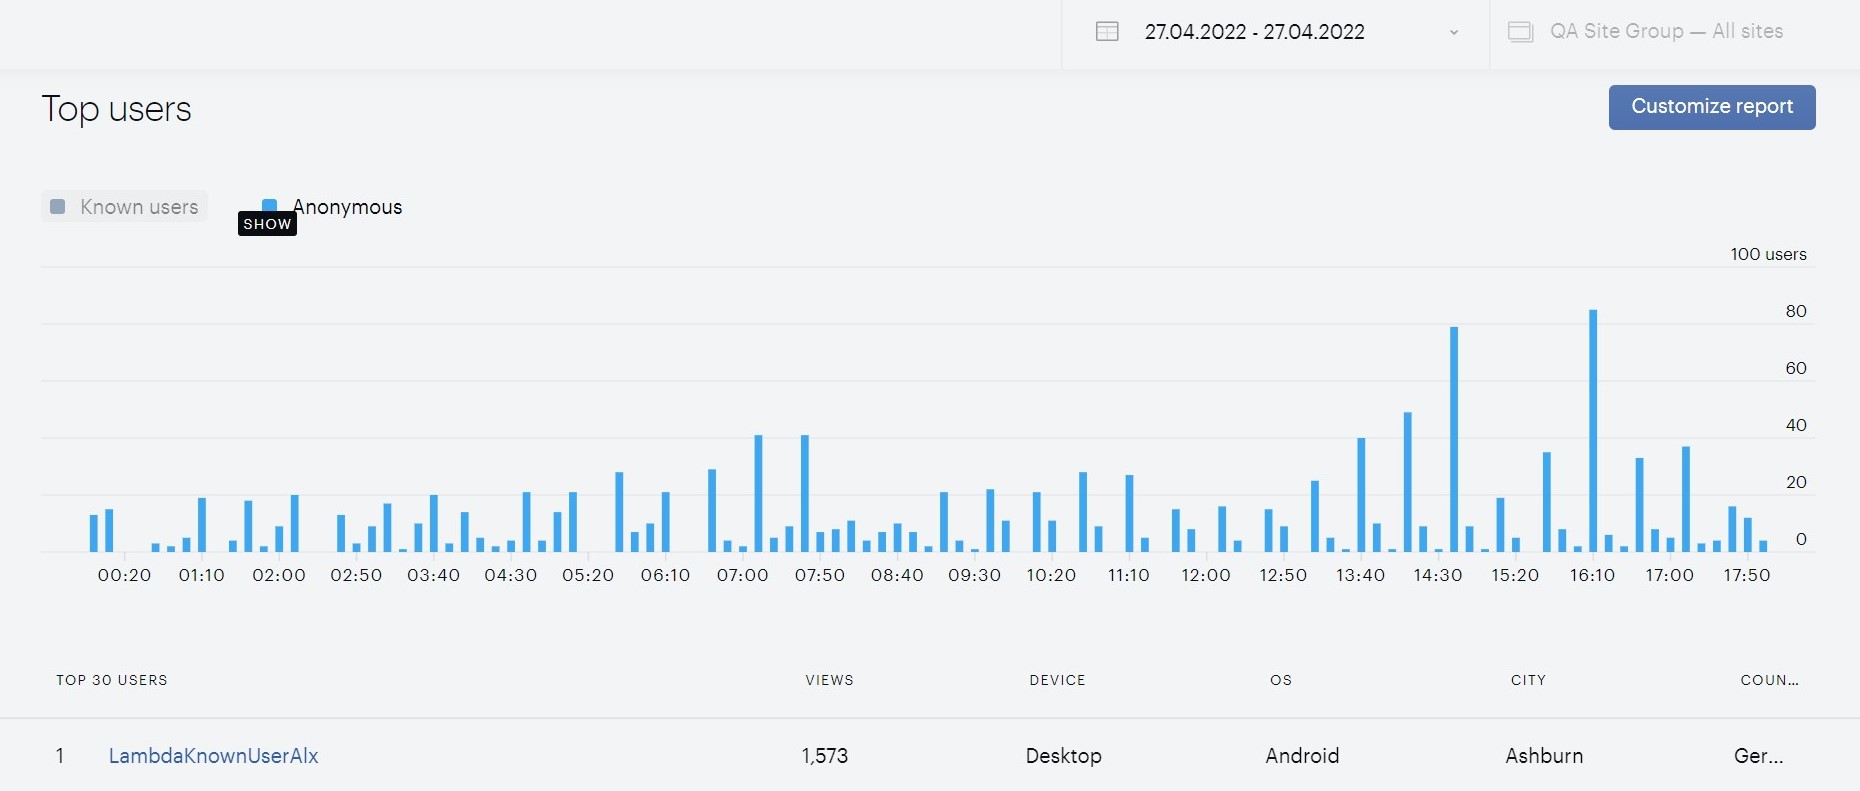
The data can be narrowed down by applying additional filters in the Customize report section as mentioned above.
The Top users table below the graph lists all registered users who performed any events over the specified period. The table shows the general information for each registered user: number of views, device specifications, and the location of the user. 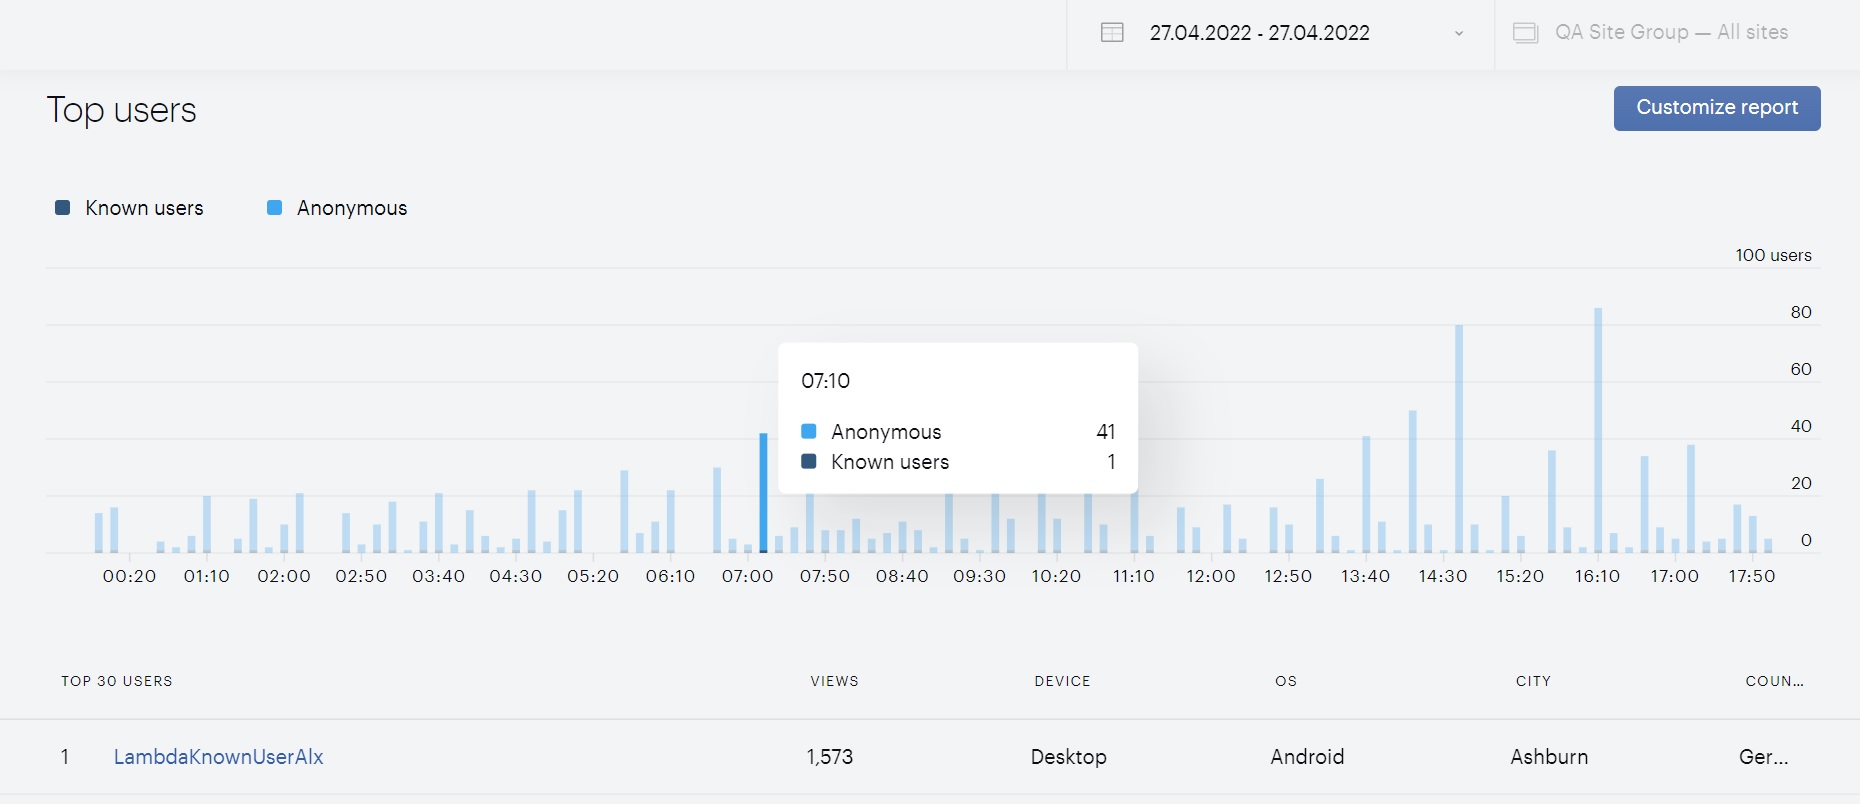
Clicking the user ID in this table brings the customer to the second report: User details.
User details
The customer can get to the User details report by clicking a user ID in the Top users table or by opening the report with Reporting→Users→User details. 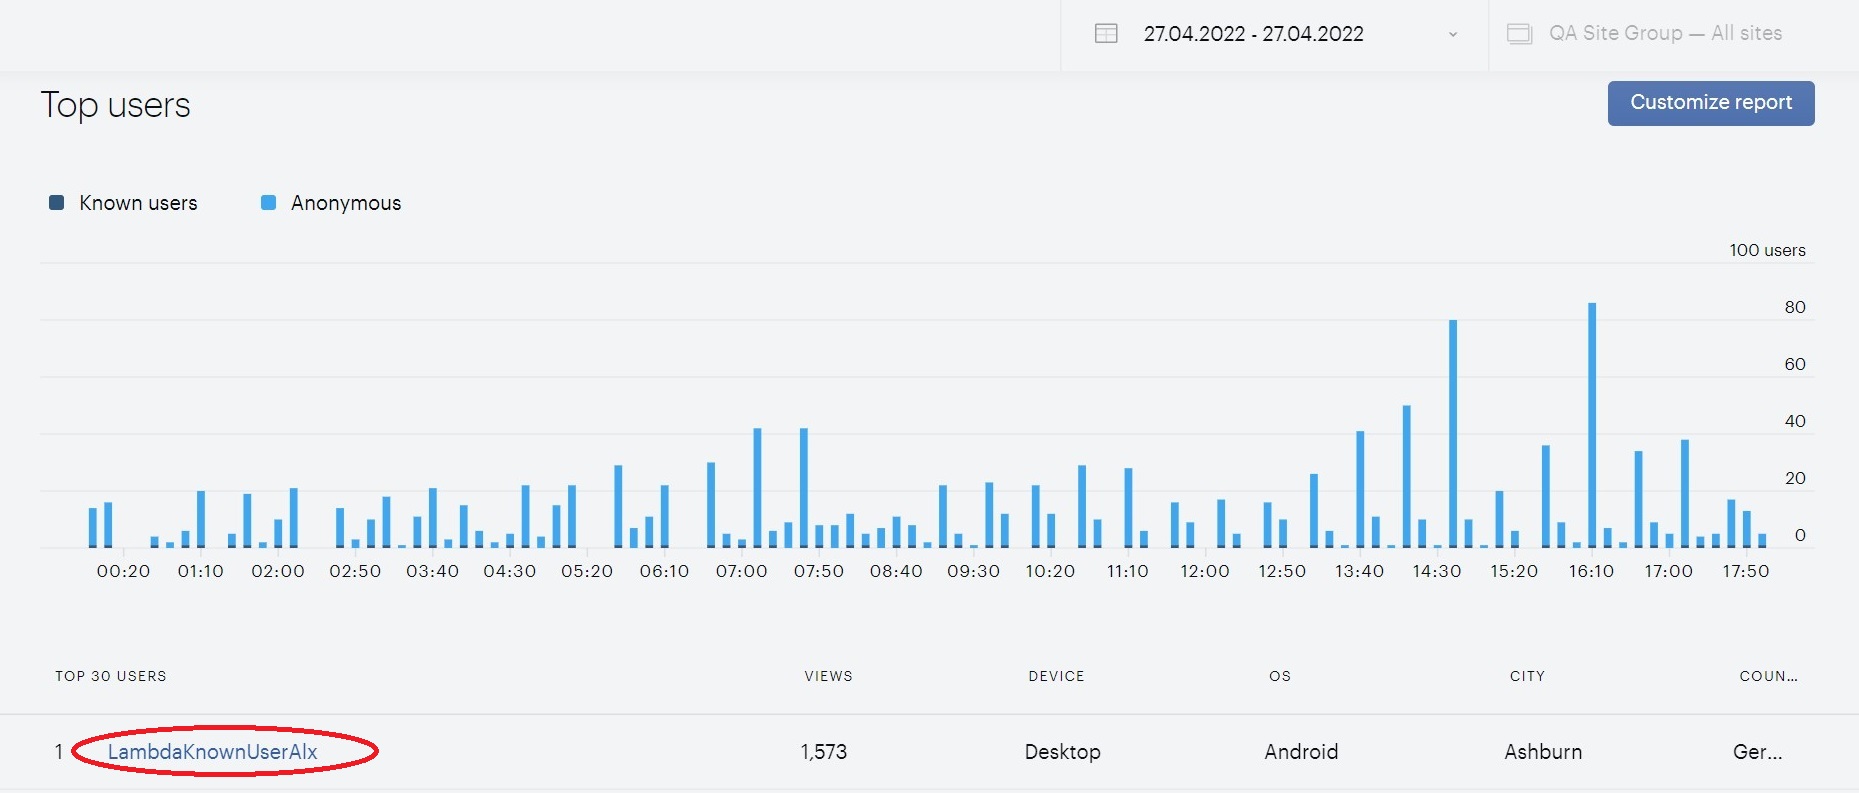
Alternatively, the customer can enter a user ID manually into the search panel at the top of the User details report. 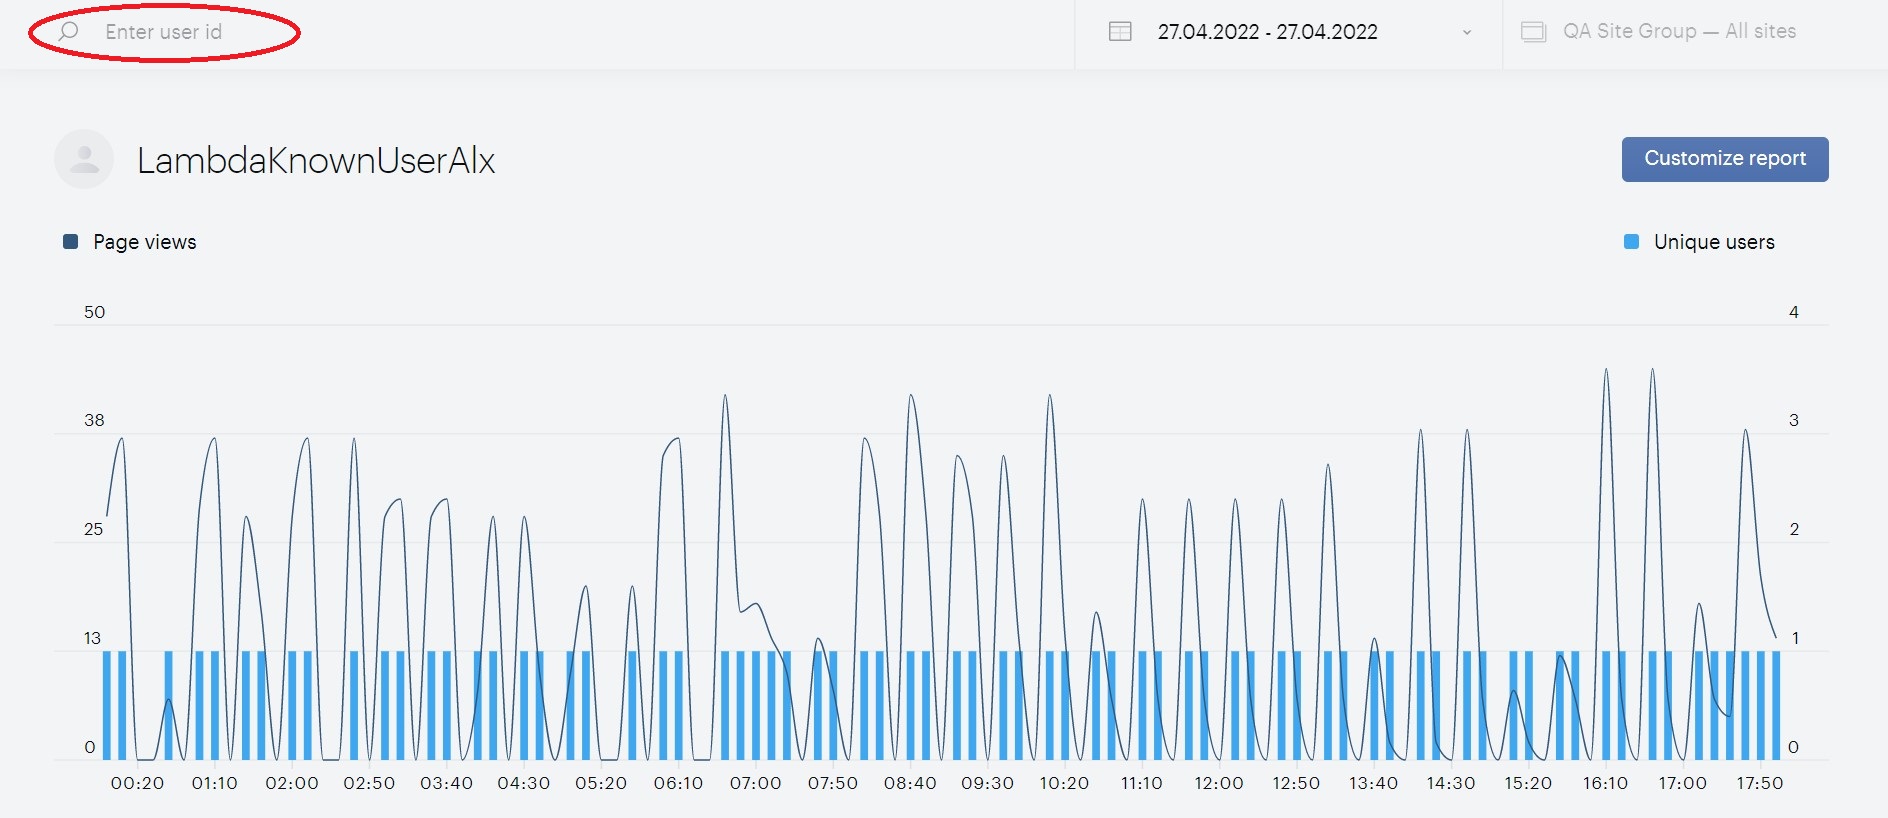
The chart in the User details view shows the overall traffic coming from the selected user. The customer can also hide the data from the graph and view the dynamics for only the number of page views or only for unique users - just click the icons in the legend above the chart area to show/hide the rows. 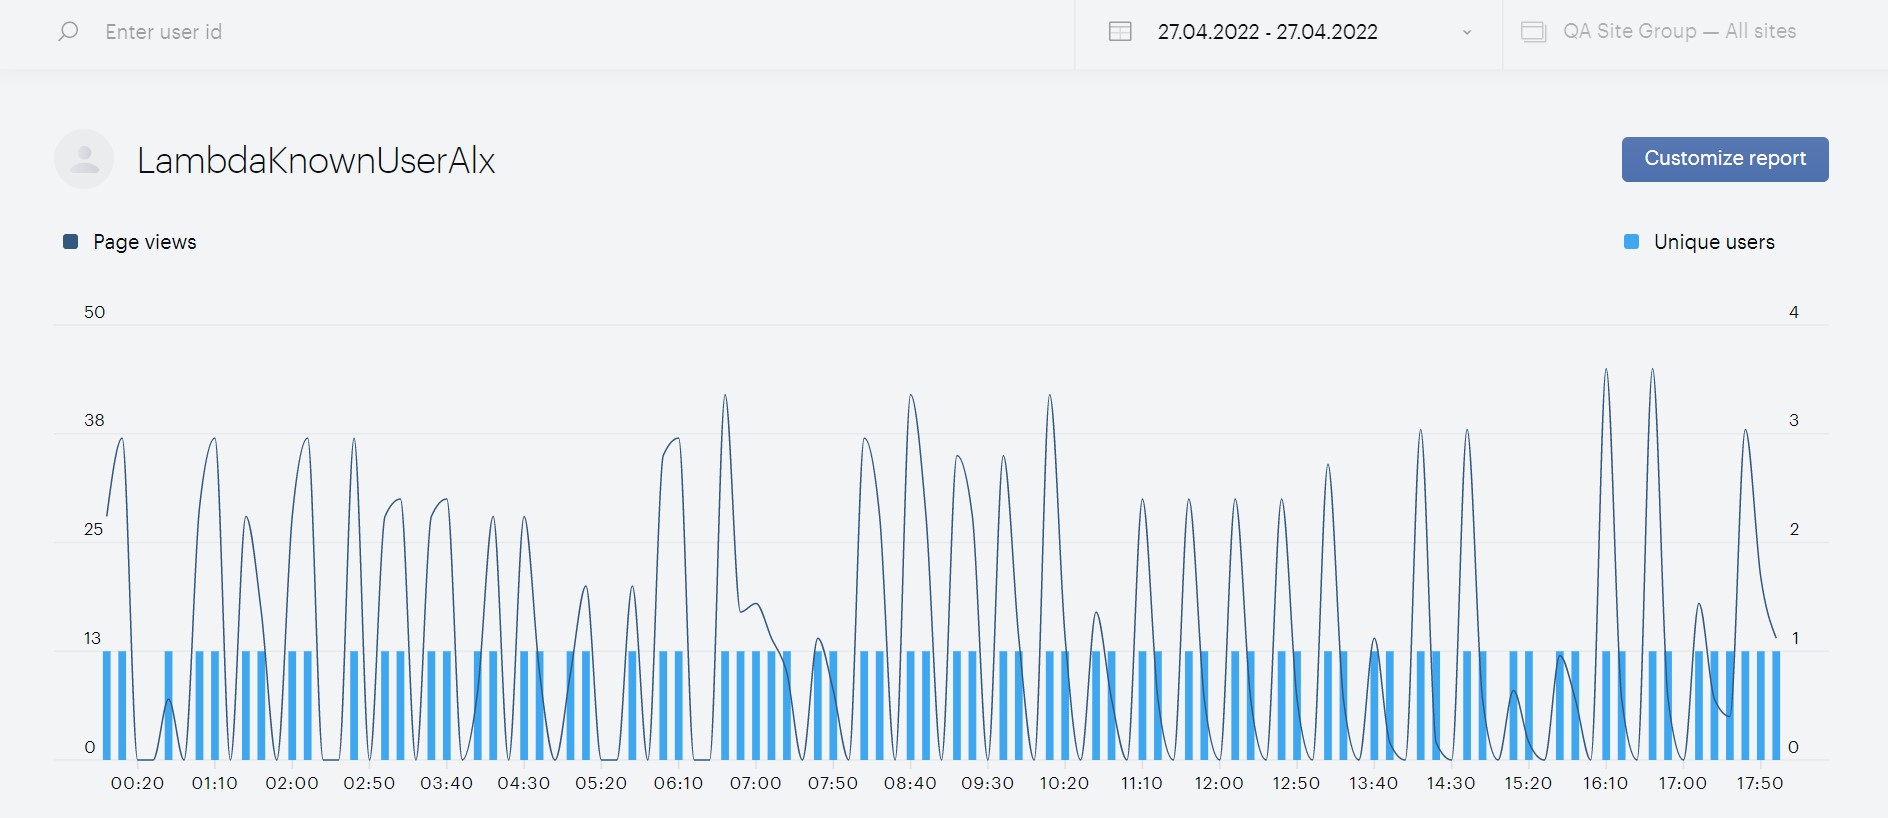
This view offers the same Customize report filter settings as the Top users part, but it displays the chart for the selected user.
There are several tabs below the chart to analyze events in different dimensions. Read details below.
Top documents
The Top documents tab lists all the documents viewed by a selected user. The following metrics are included in the table:
-
Document name or URL
-
Number of views
-
Time spent viewing the document
-
Bounce rate
-
Trend
Devices
The Devices tab splits the events registered for a selected user by device type, mobile brand, operating system, and browser used when performing the events. 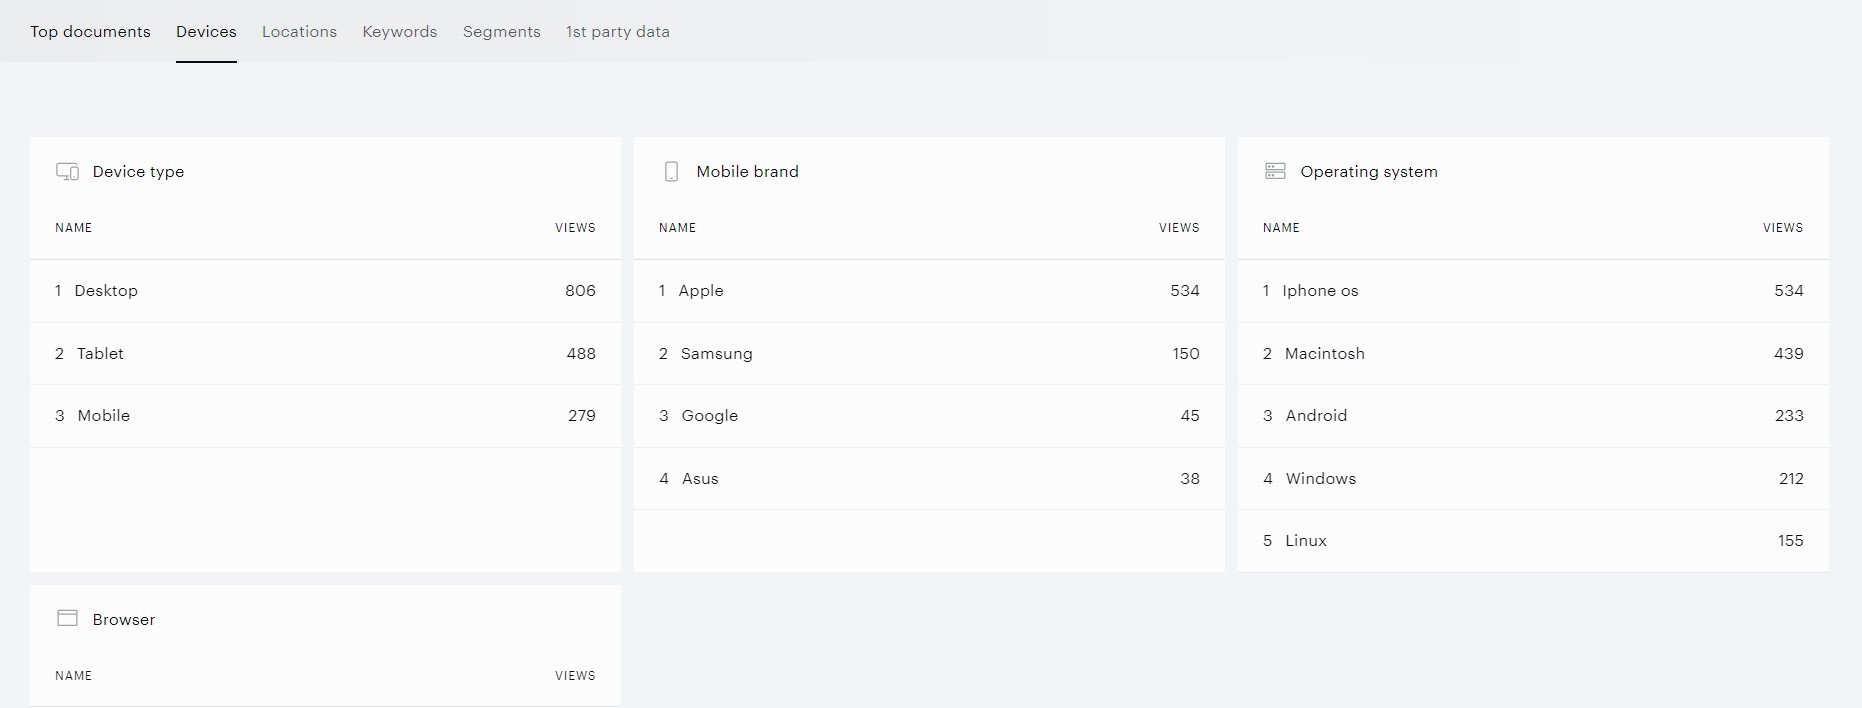
Locations
The Locations tab specifies the cities, regions, and countries the events were coming from. 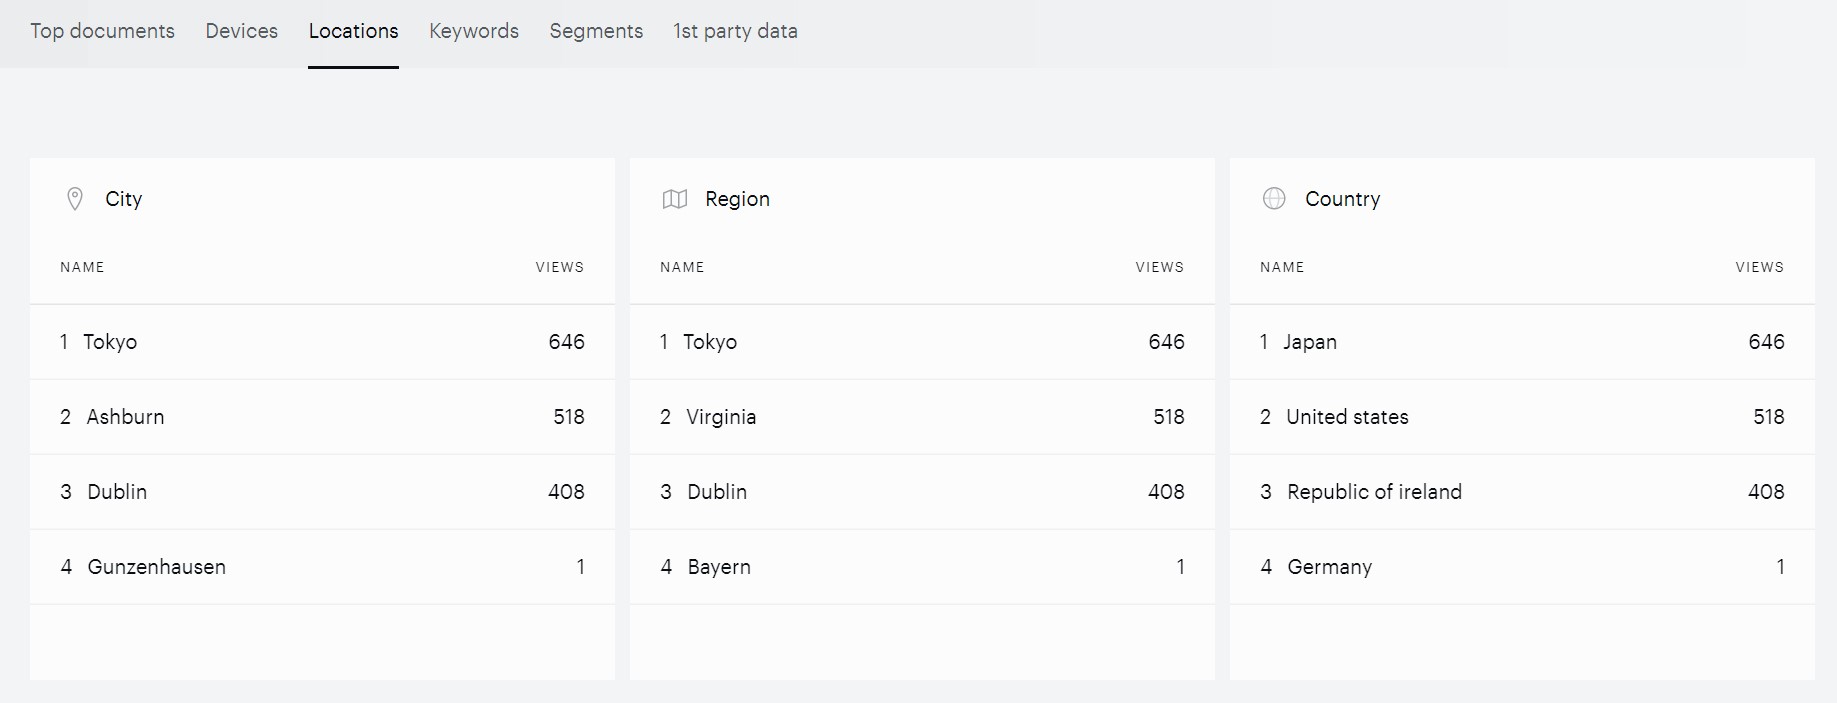
Keywords
The Keywords tab shows the statistics by keywords in the documents that the customer was viewing. 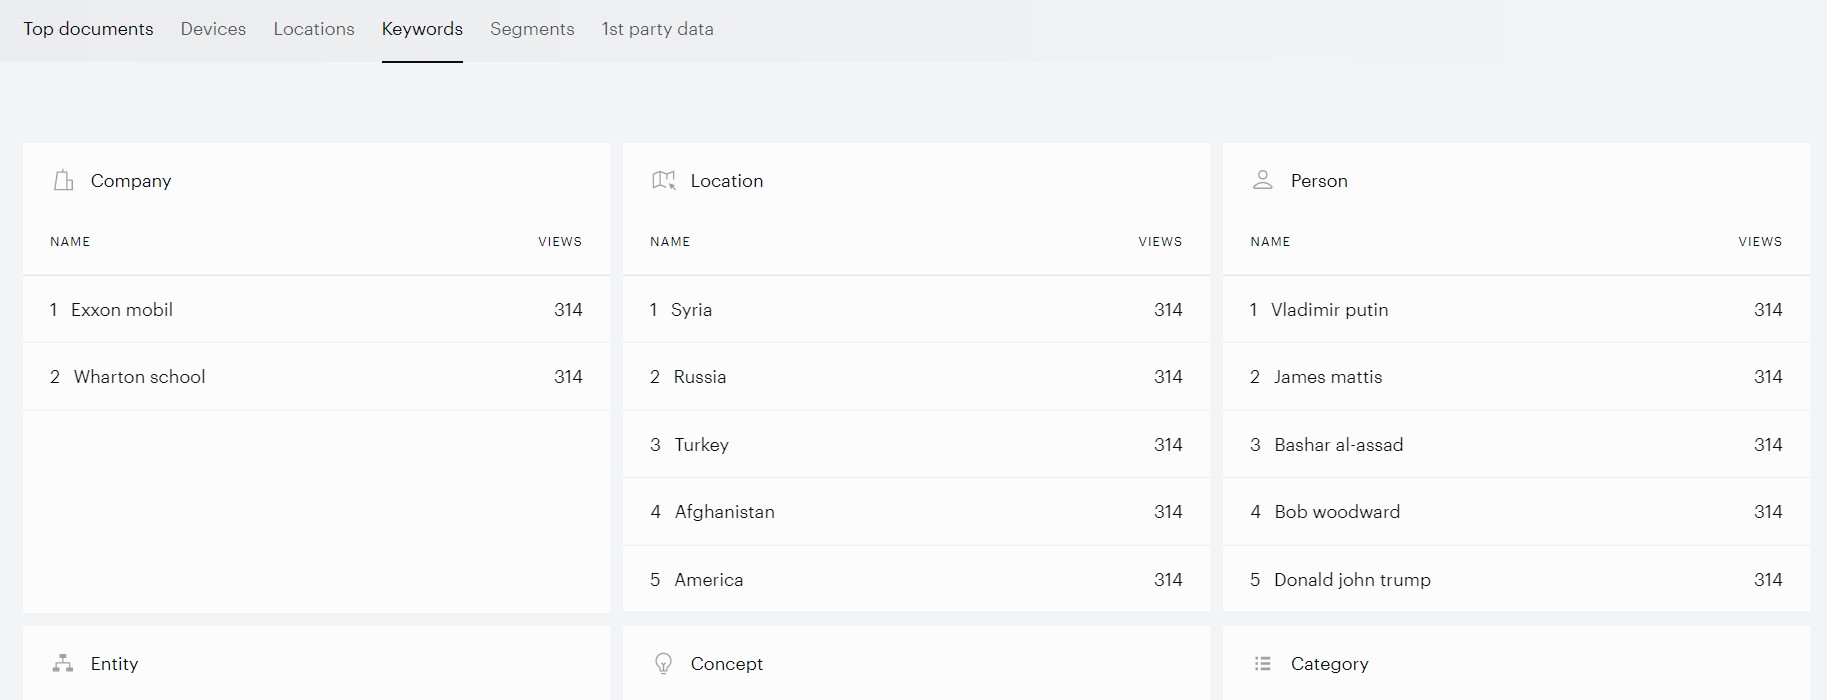
Segments
The Segments tab shows the list of segments that include a selected user. 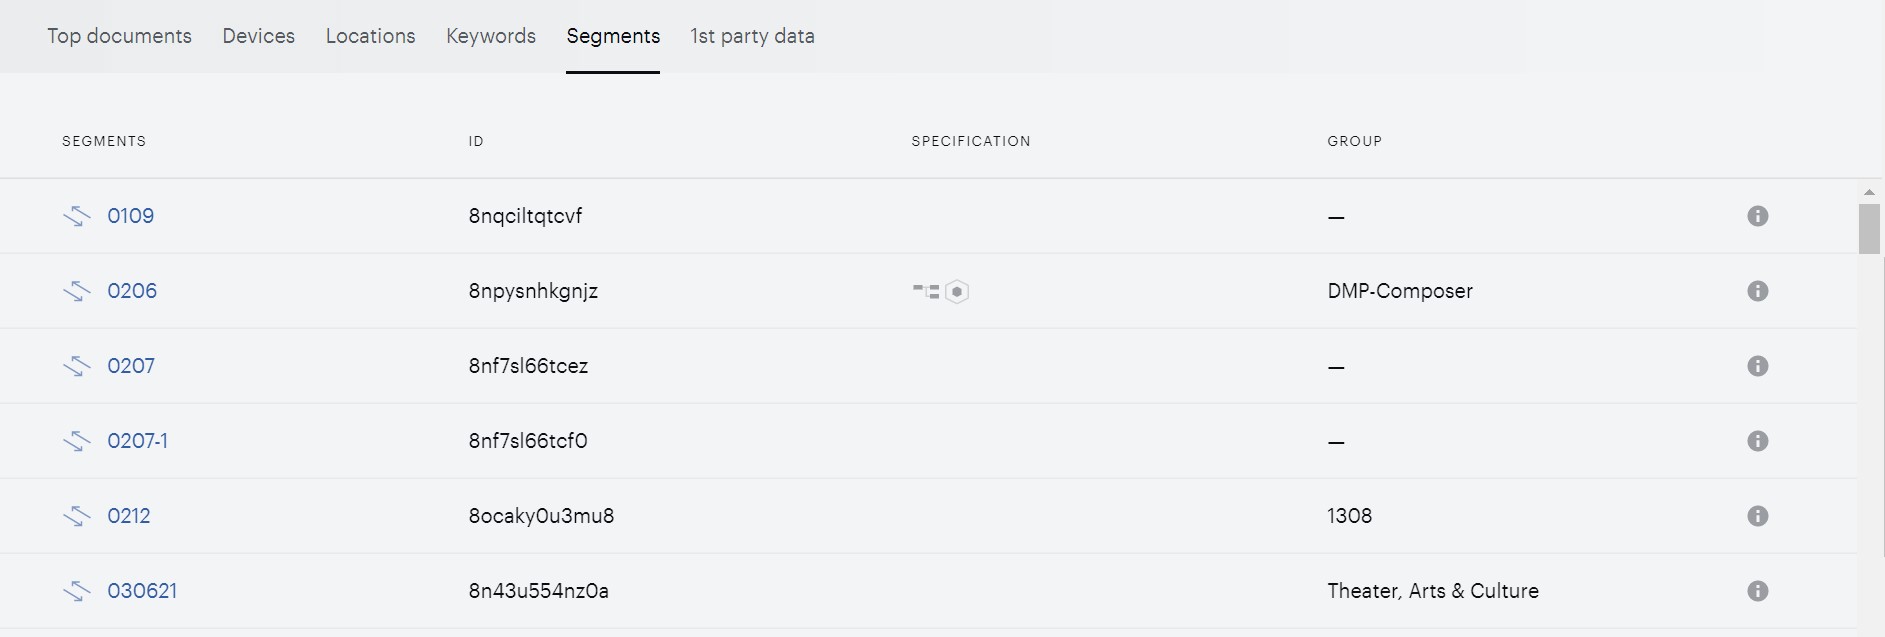
1st-party data
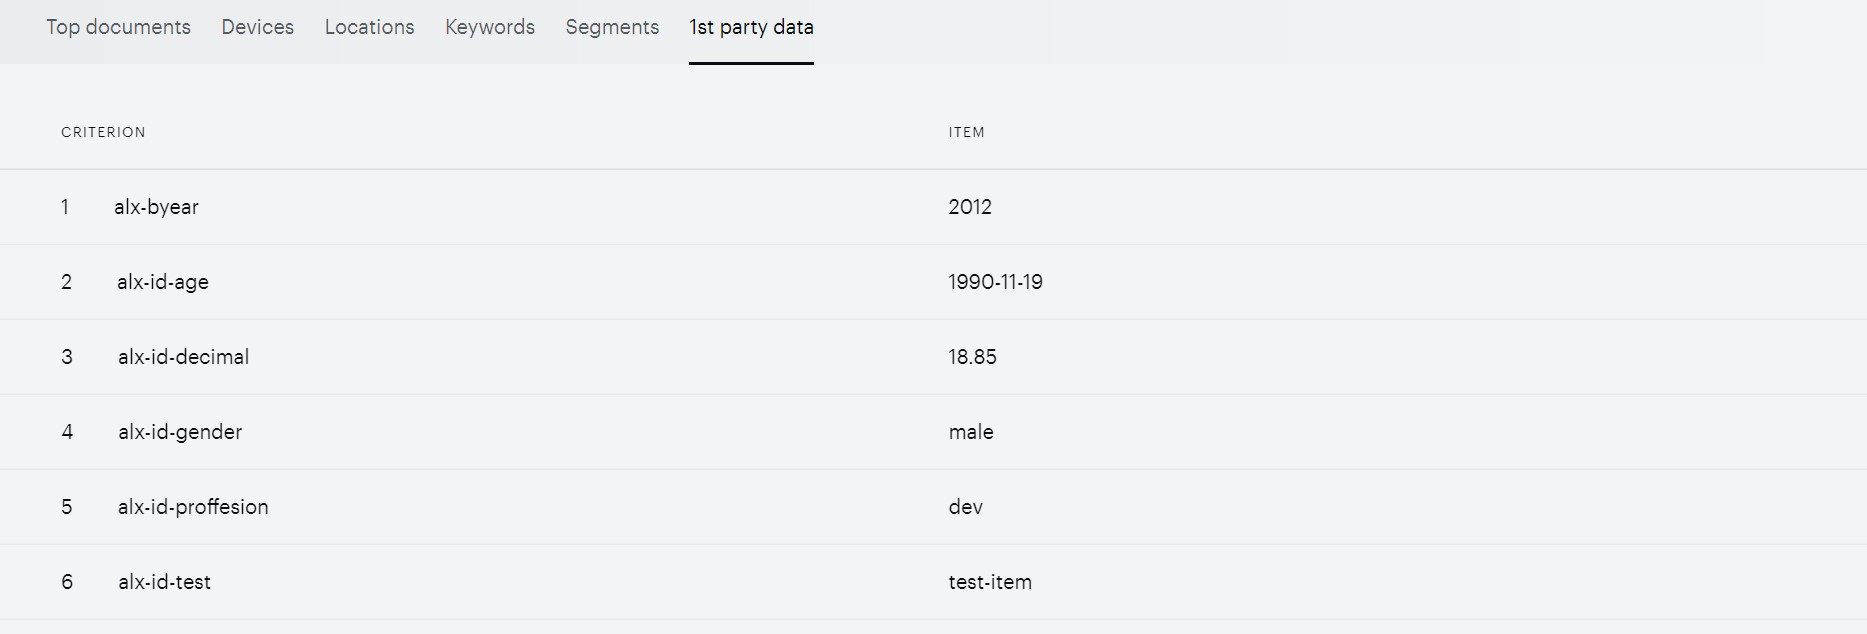
This tab shows any possible 1st-party data uploaded to Piano Audience that is associated with a selected user.