
LtS Segment Summary Overview
Piano's subscription propensity model scores your visitors in realtime on a zero to 100 scale, with 100 being the highest likelihood of conversion and 0 being the lowest likelihood of conversion. Those scores are updated on each pageview, allowing you to personalize your paid targeting in relation to conversion likelihood.
The LtS segment summary report provides you with details on key performance metrics on how the algorithm is segmenting, such as the number of visitors, pageviews, conversions, and conversion rate. The dashboards below those key metrics provide descriptive information about the nature of your propensity segments, showing various behaviors and characteristics related to pageviews, active days, referrers, device, browser, OS, and paywall hits.
Access to Report
The report can be accessed from different points in the Piano dashboard:
-
Products > Composer > Report icon > LtS Segments
-
Products > Composer > Composer Canvas > Report icon > LtS Segments
If the LtS Segments option is not visible, please contact support@piano.io to have it enabled.
Modify Timeframe
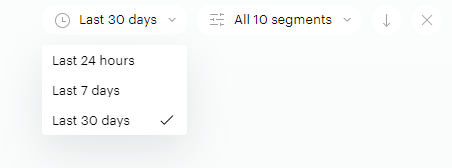
You have the option to view data by last month, last week, or last 24 hours. When first opening the report, the Last Month timeframe will be selected by default.
Signature Particle Visualization
The top visual graph in the dashboard represents a distribution of how many visitors are part of each LtS segment.
-
Each bar represents one segment
-
Each bar displays the name of the segment and the number of visitors part of the segment
Note: A graph legend is placed below the graph, indicating how many visitors each particle is representing. Depending on the size of your audience, each particle might represent 100, 1,000, or 10,000 visitors.
Modifying LtS Segment Views
If you click the "All 10 segments" carrot at the top right corner of the report you can select between the 10 segments and the low, medium, and high grouping.
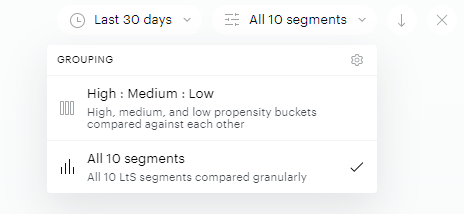
View option 1:
-
Default segment definitions "LtS segments by score range":
-
0-9, 10-19, 20-29, 30-39, 40-49, 50-59, 60-69, 70-79, 80-89, 90-100
-
View option 2:
-
Default segment definitions "LtS segments by category":
-
Low likelihood = End-user with score in range 0-29
-
Medium likelihood = End-user with score in range 30-69
-
High likelihood = End-user with score in range 70-100
-
These low, medium, and high thresholds can be adjusted. Some Piano clients will decide that visitors who have a score of 50 or above should be considered high propensity. For others it may be 80 or above.
With the benefit of the LtS segment summary report, you can see where there are inflection points in visitors, conversions, and conversion rates to help you set thresholds that fit your subscription propensity use cases.
Dashboard Customizations
If you click the "All 10 segments" carrot at the top right corner of the report, and then click the cog wheel icon in the upper right corner of the interface:
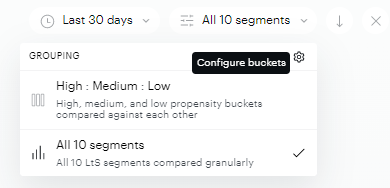
You will be able to change these low, medium, and high thresholds.
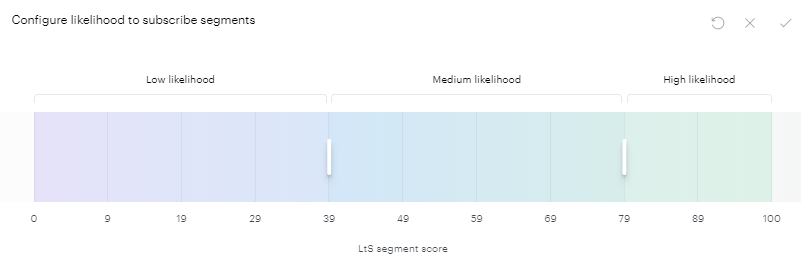
-
Navigation: Top-level menu > Segment view tab > Cog wheel
-
Cog wheel: Upon clicking on the cog-wheel, an option to tailor the definition of the low, medium, high segments
-
Segment names: "Low likelihood", "Medium likelihood", "High likelihood"
-
Interaction logic — customize segment definition: A user can change the segment definition by dragging one or both of the white segment dividers to the right/left.
-
Save: Upon clicking "v" the new, customized segment definition is saved — the user will be redirected back to the dashboard
-
Cancel: Upon clicking "X" the adjustments to the low, medium, high segments reverted back to the last saved definition — the user is redirected back to the dashboard.
-
Reset: Upon clicking the "reset wheel", the segment definitions are reset to the default definition for the "LtS segments by category"
-
Persist save settings: When a user saves the customization settings, these settings will be saved for everyone, making it visible for all users.
Unique Browsers, Pageviews and Conversions Reports
Below the signature particle visualization are charts displaying essential performance information about each of the LtS segments. The first graph shows unique visitors and pageviews and the second graph shows conversions and conversion rates.
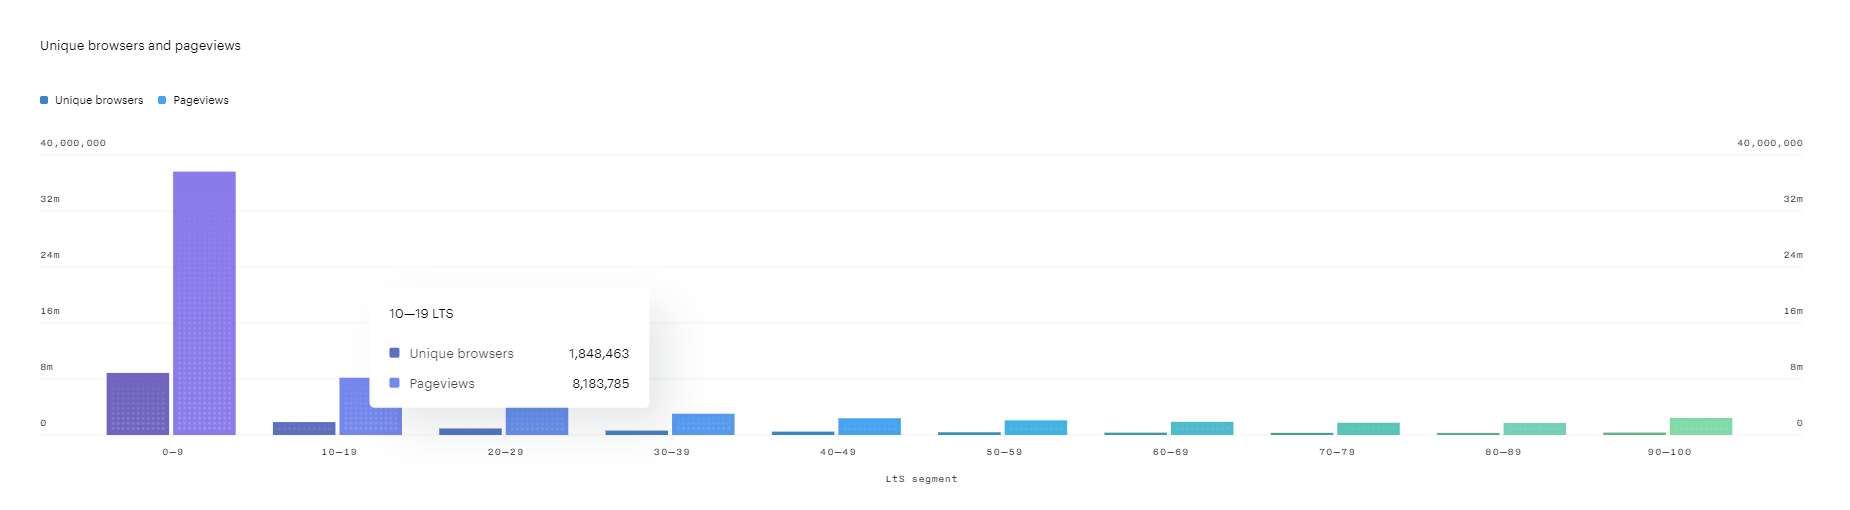
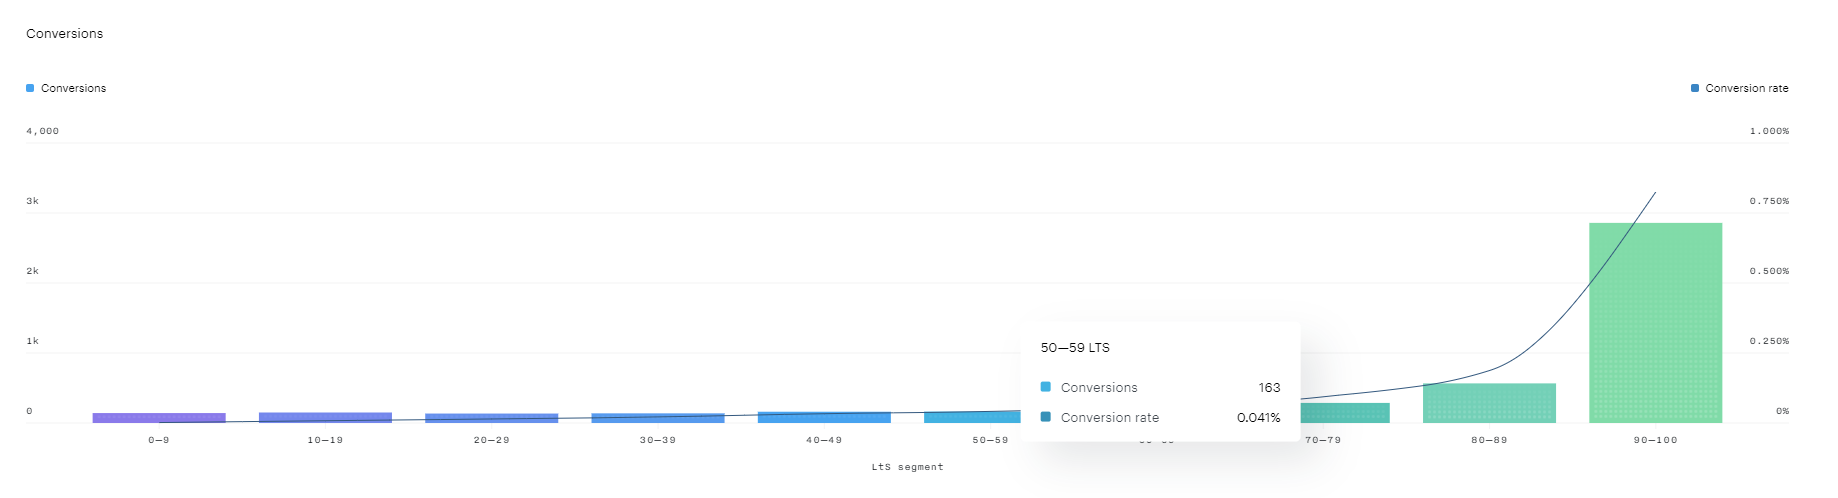
These data points can help you set propensity thresholds for your paid targeting. For example, if you are thinking about possible trade-offs between subscription offers and advertising revenue, being able to get an understanding of how many pageviews a given segment accounts for and the number of conversions they are driving should help you minimize risk to your advertising business and maximize subscription ROI when deciding on paywall rules.
When reviewing this data, there are a few important details about the numbers to keep in mind:
-
The report displays the most recent score of the visitor: Given that visitors' scores update on every pageview, visitors' scores can change over time. In order to avoid the double and triple counting of visitors and conversions, the most recent score of each visitor is used in these reports both for unique visitor counts. For conversion attribution, the score on the pageview of conversion is used.
-
The report uses UTC timezone: Days are calculated using Coordinated Universal Time (UTC), formerly Greenwich Mean Time (GMT). This may mean that the number of conversions differs from reporting based on your timezone.
-
The report only shows data going through an active Composer experience with LtS targeting: This is the reason you will likely see fewer visitors, pageviews, and conversions overall than you see in other analytics tools. The goal of the report is to show you how LtS is performing based on how you are targeting. If you are targeting LtS at a sliver of your pages or audience, then showing LtS data in relation to the full audience would not provide an accurate understanding of the algorithm's performance. This also means that if you want to see how LtS scores across a larger or smaller portion of your audience, adjusting Composer rules will automatically change the data shown in the report going forward.
-
"No LtS" pageviews, visitors, and conversions: By default, visitors, pageviews, and conversions without a score are hidden from the reporting. However, if you click on the circle in the bottom right corner of the report, you can check the box next to "show No LtS segments" and data on unscored visitors will appear in the reporting.
These no score visitors only include those visitors in LtS experiences who were not assigned a score. These no score visitors are primarily single pageview visitors because LtS does not score on first pageview. The no score segments shown in the report do not include visitors who cannot be scored (AMP visitors, for example, cannot be scored using LtS due to the significant inherent data limitations of AMP).
Behavioral and Attribute Dashboards
Below the graphs on pageviews, visitors, and conversions, you will see detailed dashboards on key visitor behaviors and attributes. Those charts include:
-
Active days: The number of active days during the selected period. Note that you may see visitors with more than one active day when selecting the last 24 hours time span due to active days being defined by calendar days.
-
Browser: The browser used by the visitor (Chrome, Safari, etc)
-
Device: The device used by the visitor (Desktop, mobile, tablet, other)
-
Operating system: The operating system used by the browser (Android, iOS, Windows, Mac OS, Other)
-
Pageviews per session: The average pageviews per session of each visitor.
-
Paywall hits: The number of times a visitor sees a Piano template with a paid term embedded within it (this chart will show zeros for clients who do not leverage Management + Billing).
-
Referrer: The number of pageviews related to each referrer class. Referrers include direct, search, social, internal, and external. Internal accounts for any session that begins onsite (often a consequence of a visitor leaving a tab open and returning to it more than 30 minutes later). External is a catch all referrer for all referrers that do not fit into the other categories.
-
Total pageviews: The total number of pageviews during the period for each unique visitor.
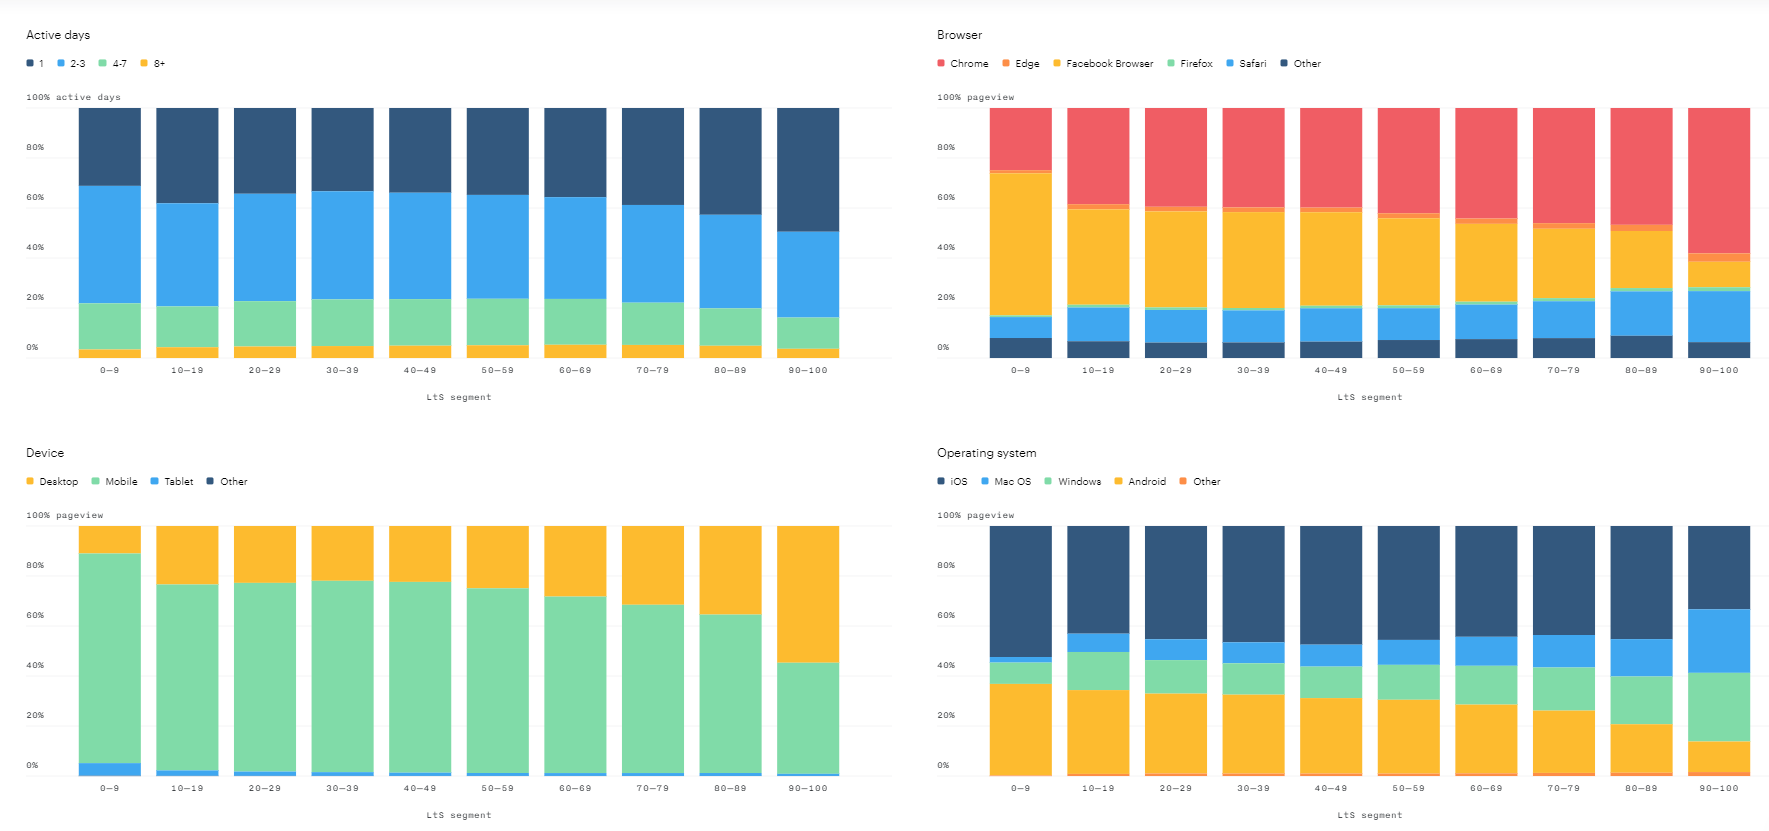
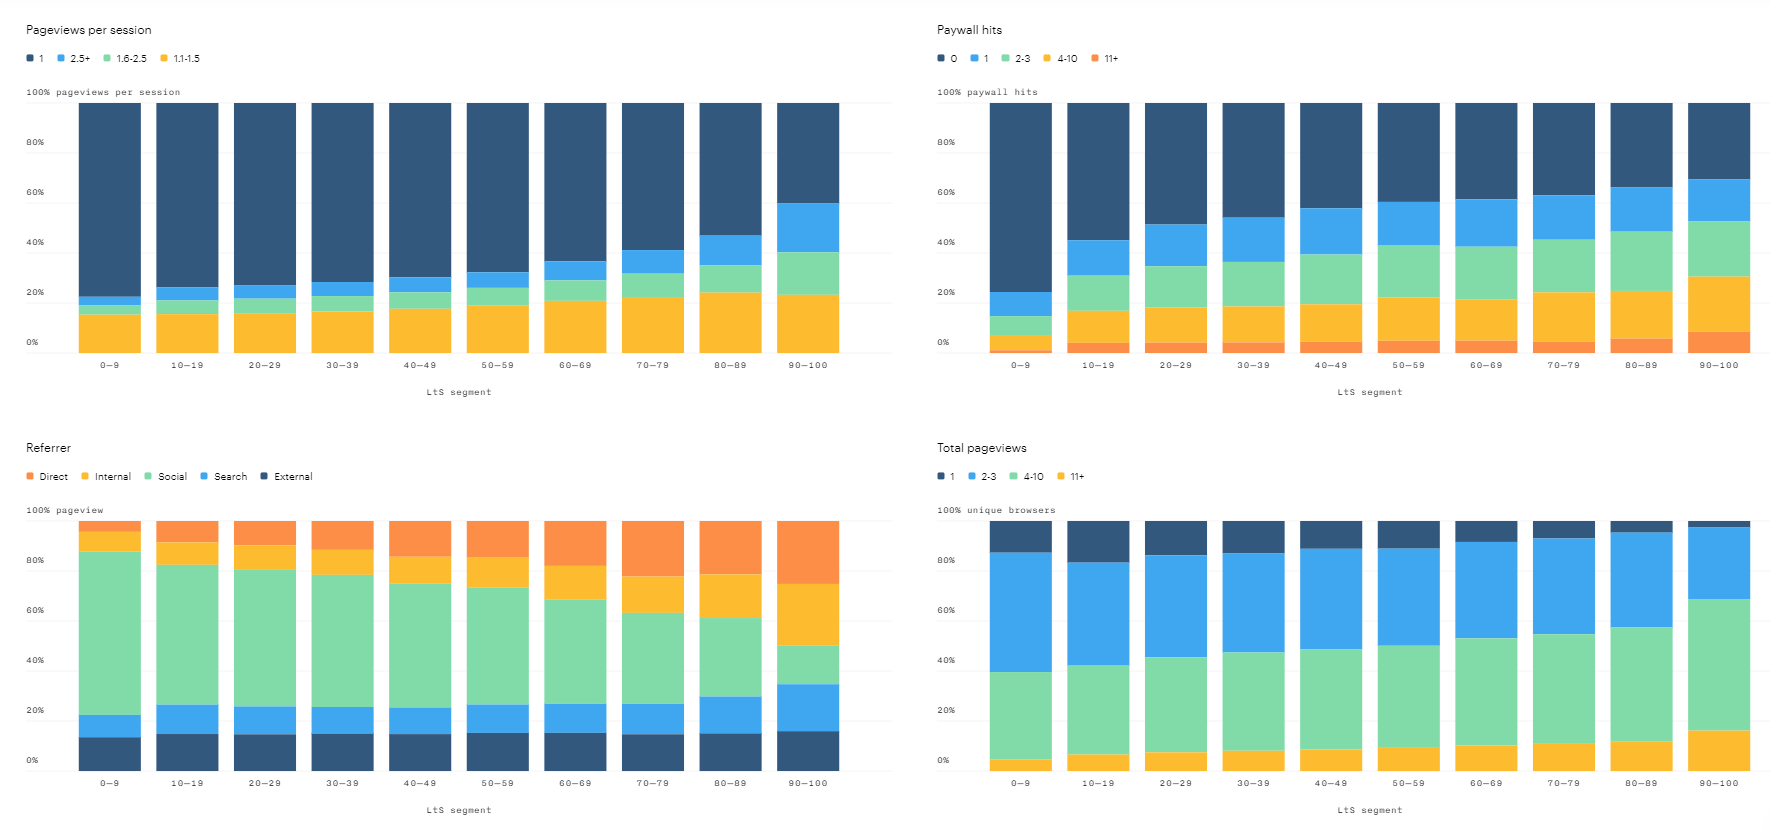
All of the above charts can be added and removed by clicking the black circle in the bottom right corner of the screen and checking or unchecking the associated boxes.
-
Graph selector: There is a persistent "black dot" graph selector in the bottom right corner of the screen that enables a user to choose what graphs are being shown or hidden from the dashboard
-
Click on selector button and select graphs to be displayed: Upon clicking on the selector button a list of graph 1-12 described in section
-
Persist save settings: When a user saves the customization settings, these settings will be saved for everyone, making it visible for all users.
Machine Learning Model Information in LtS Reporting
Three model status indicators are presented below the signature particle visualization: "Model status", "Conversion uplift" and "Last trained on."

More information on those indicators is below:
-
Model status - "Ready to use": Indicates that there were sufficient numbers of conversions to train the model (the minimum is 100 conversions in the past 31 days), the model has trained successfully, and LtS model can be used for targeting.
-
Model status - "Give it more time": Indicates that the model is not yet ready for use. The most likely reason for such a message is insufficient number of conversions for training.
-
Conversion uplift: The percent uplift in conversion rate for highest LtS group vs the lowest LtS group. This is an important metric because one of the primary ways Piano analyzes model quality is by differences in conversion rates between high and low segments — since big gaps in conversion rate mean different targeting strategies may drive better results.
-
Last trained on: Indicates when the model was last trained. The LtS model is designed to re-train daily with the past 31 days of data. However, machine learning training runs do not always produce high quality models. For this reason, Piano has automated quality checks that reject bad quality models and prevent them from being used in production. In the event that a training run fails, the last successfully trained model will be used until there is a new successful training run (using a model trained days earlier typically has minimal performance impact). If a model fails to train for an extended period of time, an alert fires in order for Piano's data science team to investigate.
Show Top 10 LtS Model Features Tab
Upon clicking on the menu tab, located below the signature particle visualization, you will see a list of the top 10 LtS features (a feature is a computed metric used by a machine learning model). The features are ordered from 1-10, where 1 is the most important feature in the model in the most recent training run. This list is specific to your audience since each LtS model is trained specifically on your audience and conversion data.

A green up arrow next to a feature indicates that the feature is related to higher subscription likelihood while a red down arrow indicates a feature is related to lower subscription likelihood.
For the data scientists on your team, there is also a detailed export available by clicking the down arrow in the upper right-hand corner of the report and then selecting "download model data." This downloads a JSON with key details on model training and performance.
For more details on that data science export and for detailed descriptions of all features in the model, please see this page.
LtS Algorithm General Overview
For information on requirements to activate the LtS model, details on how to use the LtS model in the Composer interface, and FAQs on the nature of the algorithm itself, please reference this documentation.