
A board is made up of tiles, each one displaying data from reports or funnels created in Data Query. You can also add section tiles to visually organize your board, and text tiles to add explanatory content.
Create a board
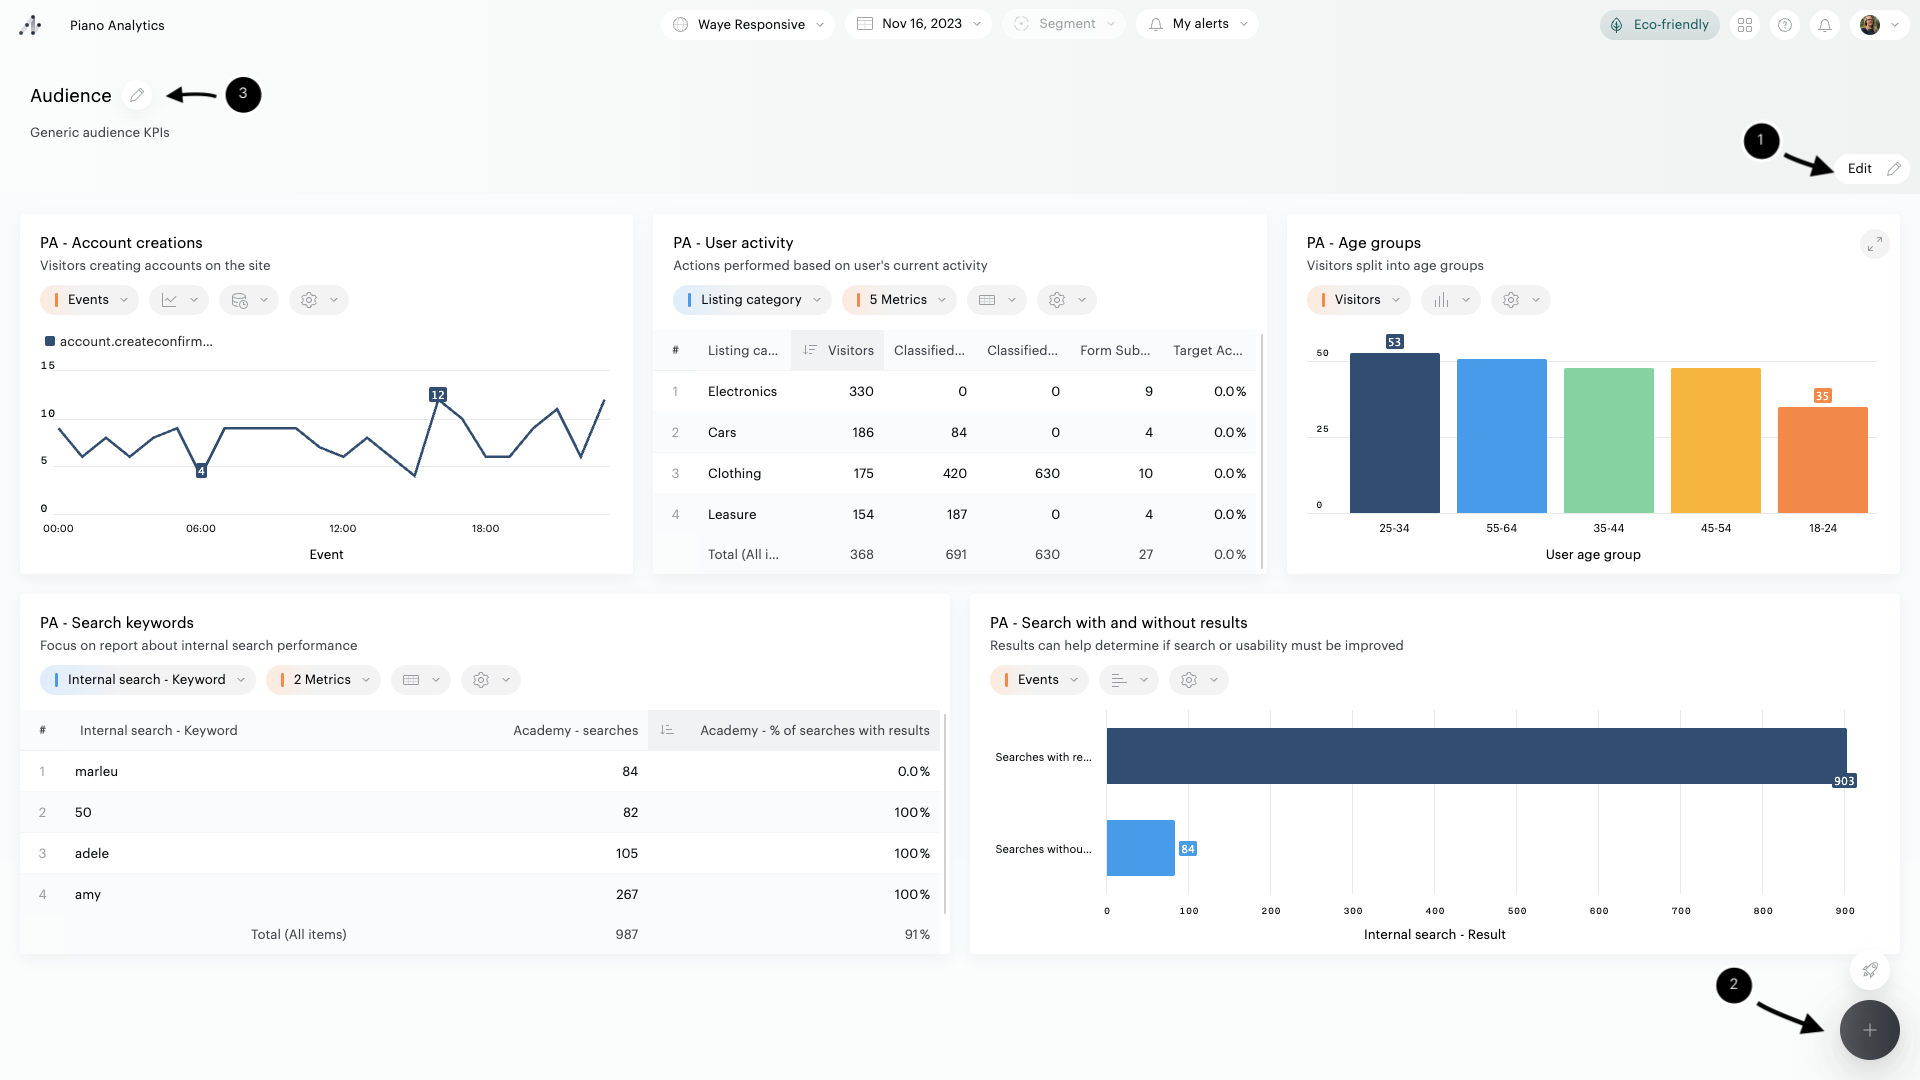
To create a board, open the Library or Data Query, then click on the "+" button at the bottom right of the interface. Select "New board".
Edit an existing board
You can open a board for editing from several places:
-
On a board in view mode, click the Edit button, or the "+" button at the bottom of the screen.
-
In the Library, click the edit pencil.
-
Use the Library's quick edition mode when you only want to make a few changes to the title, the description, or the visibility (public/private) of the board.
Most of the actions below require edit mode. When a step needs it, switch to edit mode first.
Add content to your board
Add reports and funnels
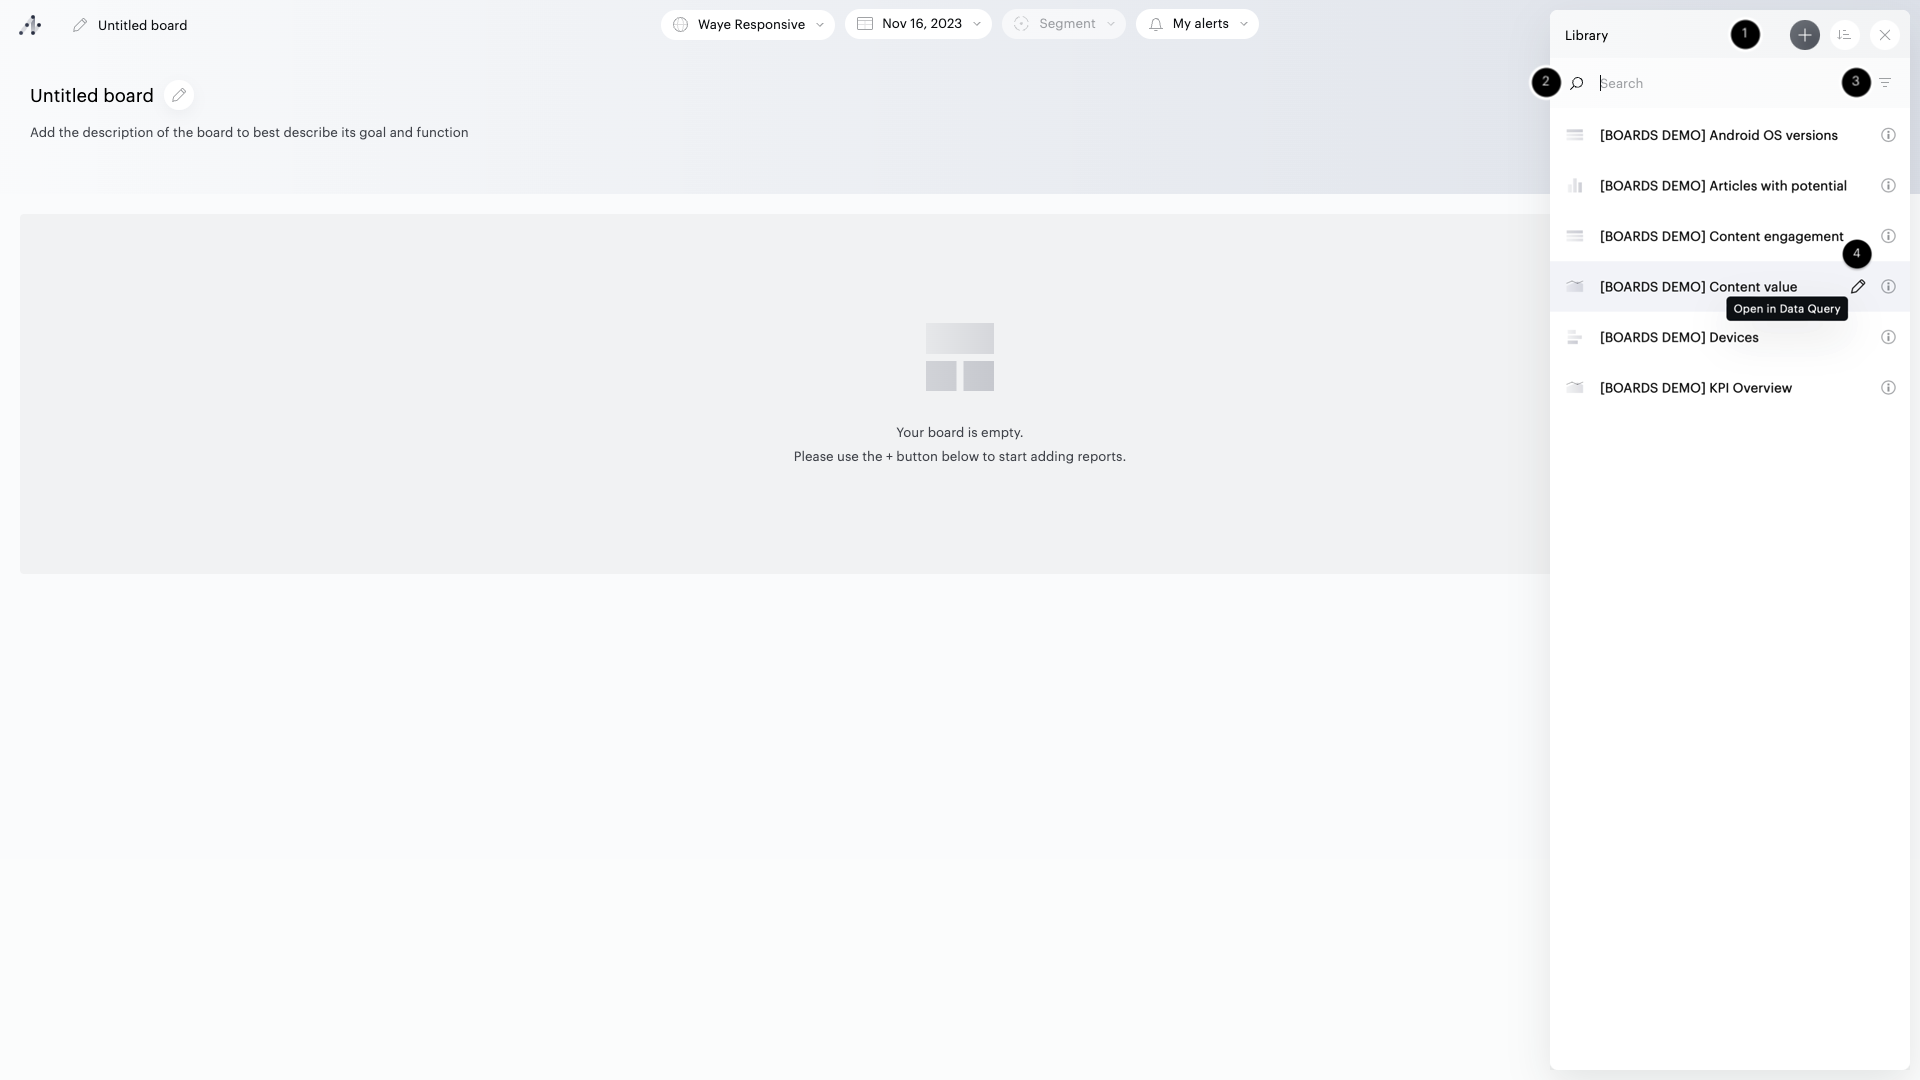
To select the reports or funnels to be added to your board, click on the "+" button in the lower right corner of the Library.
A side panel lists all the reports and funnels you have access to (private and public):
-
To create a new report to add to your board, click the "+" button at the top of the panel. You get two options:
-
Create a report builds a new report directly in the board as a live report tile (see below).
-
Create a report from Data Query opens Data Query in a new window to build it there. When you return to your board, the newly created report is instantly available.
-
-
Search to refine the list of available reports and funnels.
-
Filter the list by ownership: all reports and funnels, only yours, or only those shared with you.
-
Edit reports and funnels directly in Data Query.
Good to know
-
If you add one of your Private resources to a board, that resource becomes visible to everyone you share the board with, but only in the context of this board.
-
You can't add more than 20 tiles on a page.
-
You can't add more than 4 tiles per row.
Create a live report
A live report lets you build a new report directly as a tile on your board, without switching to Data Query first. The report is created and displayed in place, and behaves like any other tile.
-
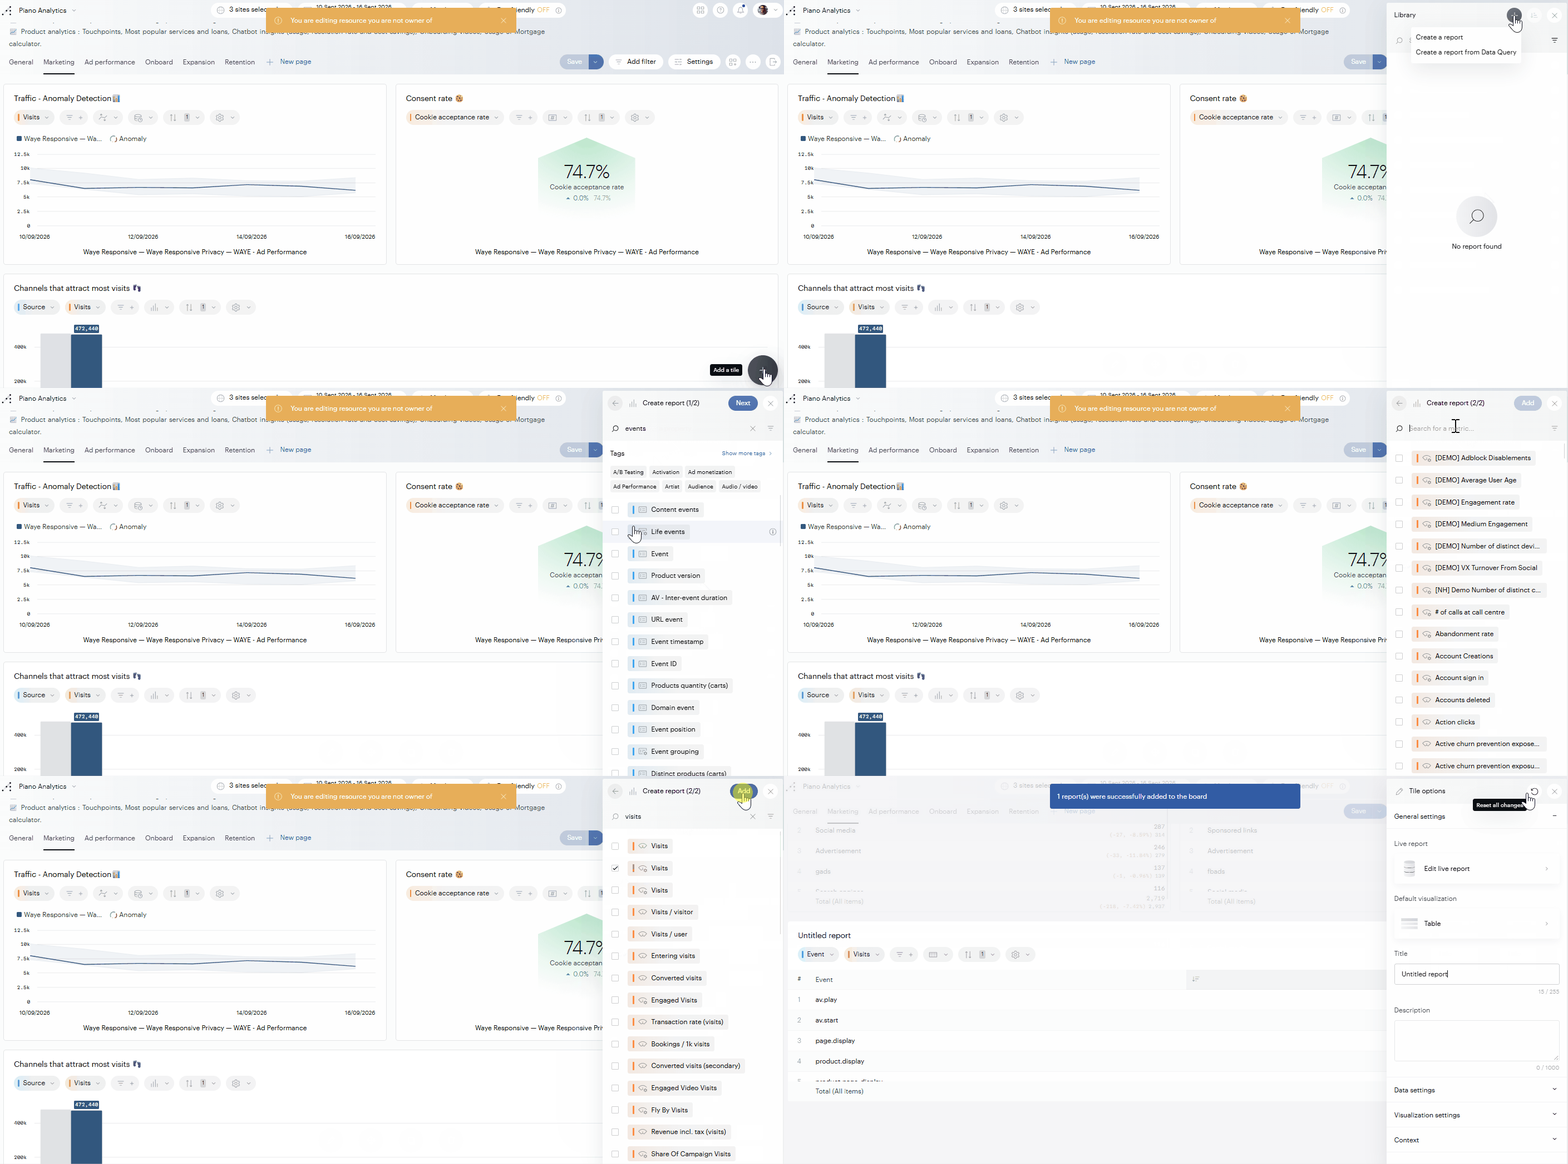
Click the "+" button to add content to the board.
-
At the top of the mini-library, click the "+" button and select Create a report.
-
Build your report. It appears as a tile in the board layout.
To edit a live report later, open the tile's configuration.
Good to know
-
A live report lives in the board: it is not listed in your Library, and you won't find it when searching in Data Query.
-
To turn it into a standalone report, open the tile in fullscreen, click Open in Data Query, then use Save as. The report is then saved to your Library.
Organize your board with section tiles
Section tiles let you visually group content on a board with a labeled, colored banner. They're useful on large boards with many tiles, where they make navigation easier and help highlight key areas.
A section tile spans the full width of the board and doesn't display any data, its purpose is purely to structure and label your content.
Add a section tile
You can add a section tile in two ways:
-
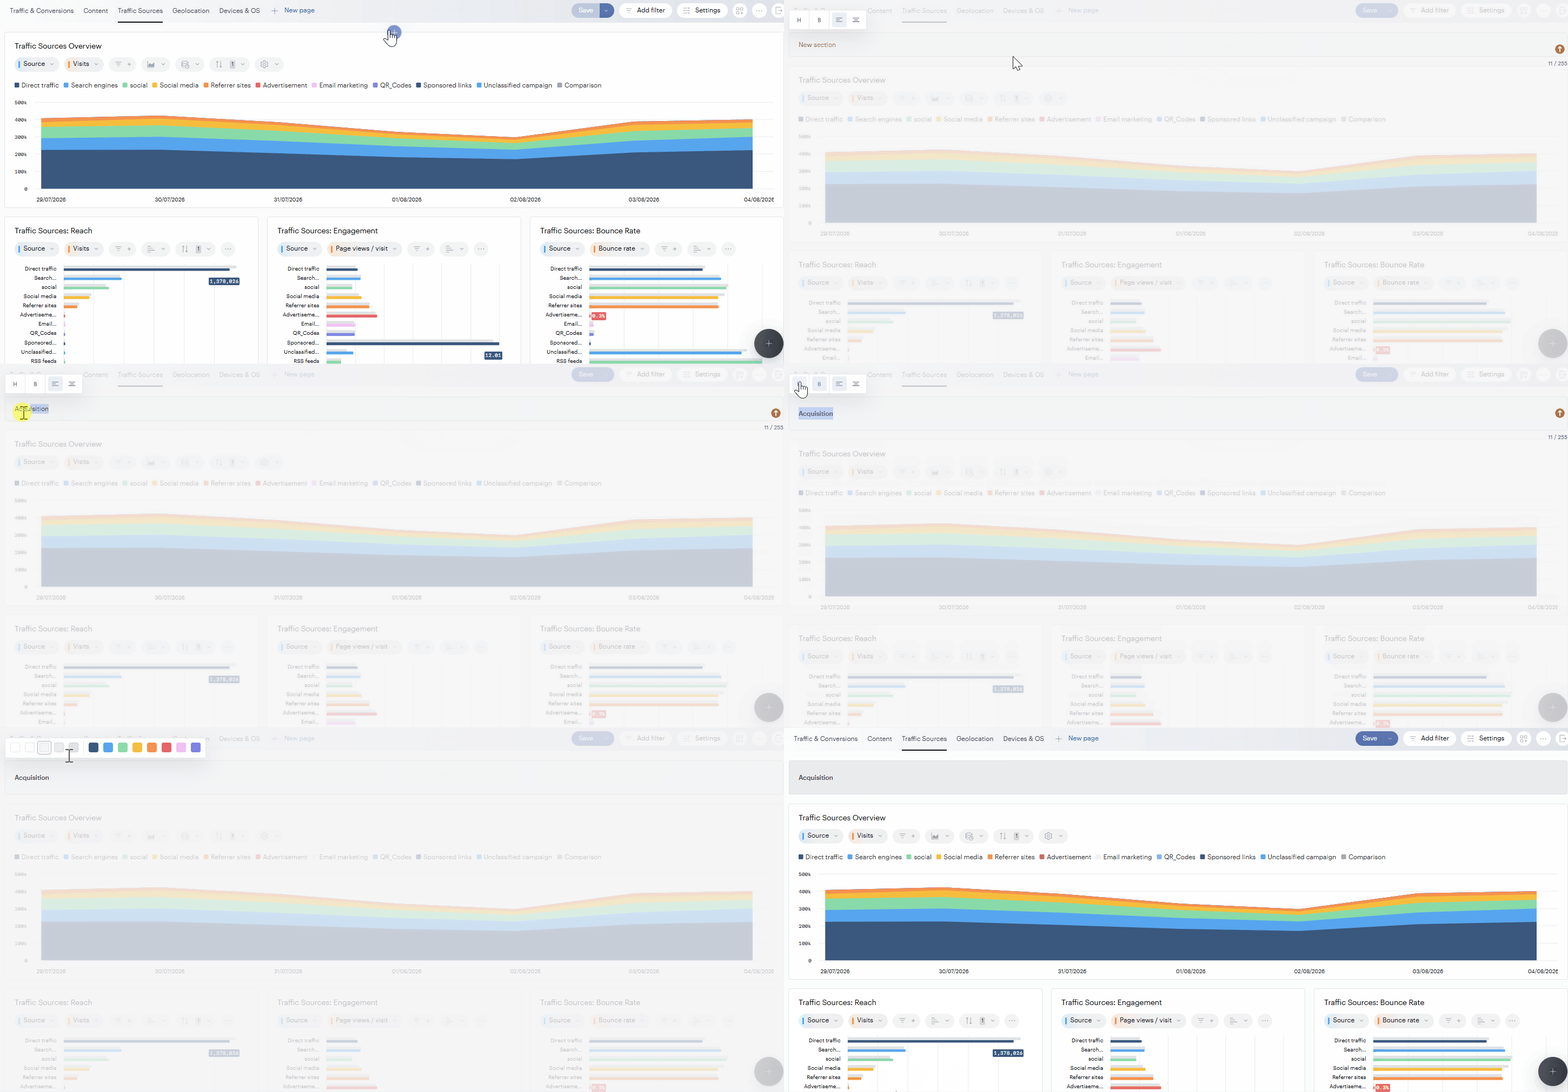
From the "+" button in the bottom-right corner of the board: click Add a section. The new section is added at the end of the board.
-
Between existing tiles: hover over a horizontal separator between two rows of tiles and click the "+" icon that appears. Select Add a section. The new section is inserted at that position.
Once added, the section enters edit mode automatically: a backdrop appears around the tile, and a formatting toolbar appears above it.
Edit the title
Type the title directly into the section (up to 255 characters). Use the formatting toolbar above the tile to adjust the styling (heading, bold, text alignment, etc.)
Click anywhere outside the section to validate the title. The backdrop is removed and the section is displayed normally, with a default background color.
Change the background color

To change the background color, hover over the section in edit mode and click the palette icon on the right.
A color picker appears with two groups of colors:
-
Five fixed light-to-dark greys, always available.
-
Colors from the board's color palette, appearing after the greys.
Click a color to apply it. The text color adjusts automatically to remain readable, white on darker backgrounds, dark grey on lighter ones.
If the board's color palette changes, for example, if you switch to a different preset, each section keeps the same position in the palette. If no color is available at that position in the new palette, the section falls back to the default light grey.
Manage sections
You can also select multiple sections by clicking the selection indicator on the left of each one, then perform bulk actions (such as deletion).
PDF exports and preview mode
Each section tile creates a new page in the board's PDF export and in preview mode. Use this to structure your exports around the same logical groupings you've defined on the board.
Add explanatory text with text tiles
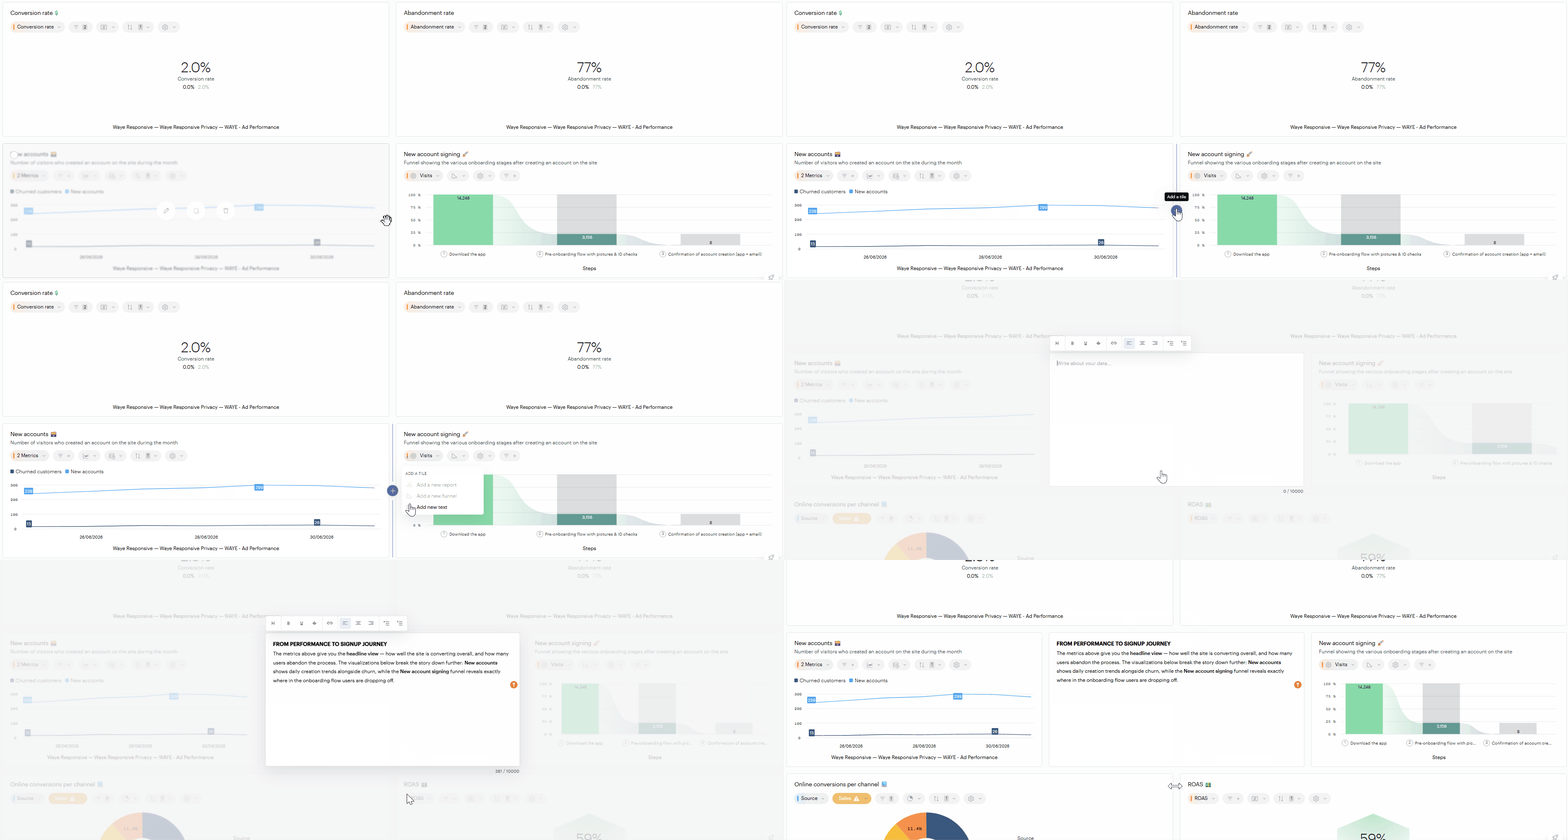
Text tiles let you add commentary, context, or instructions directly on your board. They're useful for explaining data, guiding readers through a story, or documenting how a dashboard should be read.
Unlike section tiles, text tiles behave like regular data tiles: they can be resized and placed alongside other tiles in the same row, or take the full width of the board.
Add a text tile
You can add a text tile in two ways:
-
From the "+" button in the bottom-right corner of the board: click Add new text. The new text tile is added at the end of the board.
-
Between existing tiles: hover over the space between two tiles, either between rows or between tiles in the same row, and click the "+" icon that appears. Select Add new text. The new text tile is inserted at that position.
Once added, the text tile enters edit mode automatically.
Edit the text
Type your text directly in the tile. The formatting toolbar above the tile provides:
-
H: Format text as a heading.
-
B, U, S: Bold, underline, strikethrough.
-
Link: Add a hyperlink to selected text.
-
Alignment: Left, center, or right align.
-
Lists: Bulleted or numbered lists.
Click anywhere outside the tile to validate the text.
Manage text tiles
When you hover over a text tile in edit mode, three action buttons appear:
-
Pencil icon: Return to editing mode to change the text or formatting.
-
Duplicate icon: Create a copy of the text tile.
-
Trash icon: Delete the tile.
Arrange and customize tiles
Change the layout of the tiles
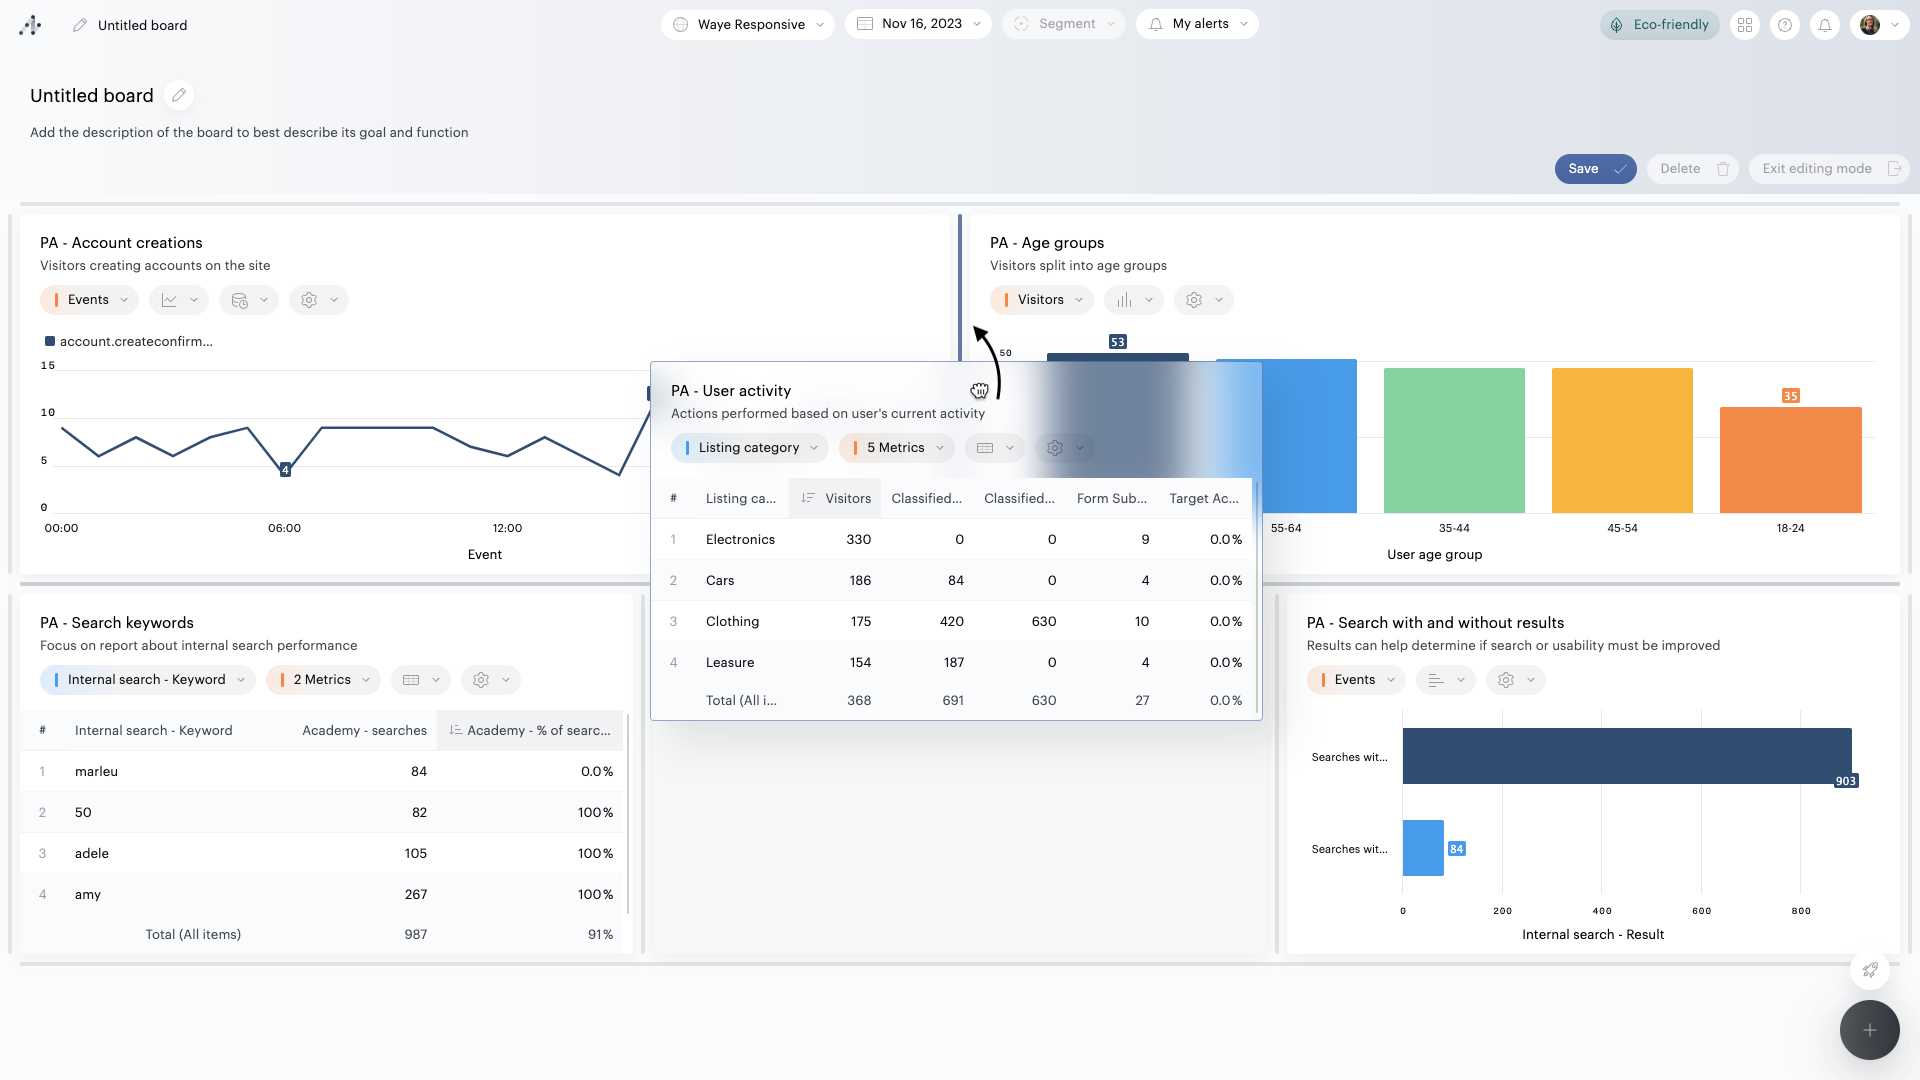
You can change the layout of the tiles by dragging and dropping them to specific locations:
-
Click on a tile and move it to the desired location
-
Separators appear showing where you can move the tile
-
To place a tile, move it over the desired separator, wait until it turns blue and then release the click
The board will automatically adjust the size of the tiles according to the location you choose.
Select, move, and duplicate tiles across pages
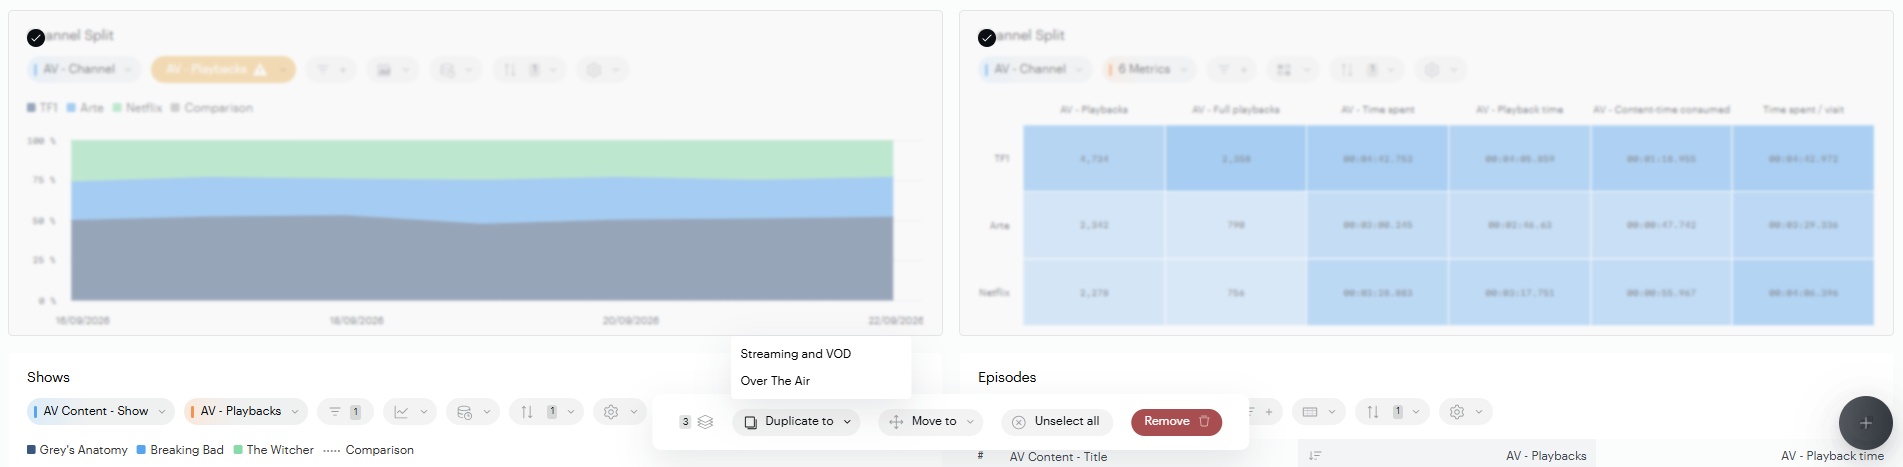
In edit mode, you can select several tiles at once and move or duplicate them to another page, so you don't have to recreate the same tiles on each page.
-
Hover over a tile: a round checkbox appears in its top-left corner. Check it to select the tile, and repeat for each tile you want. Uncheck a box to deselect.
-
Once at least one tile is selected, a bar appears at the bottom of the screen with the available actions.
-
Choose an action:
-
Duplicate to: copy the selected tiles to another page, keeping the originals in place.
-
Move to: move the selected tiles to another page, removing them from the current one.
-
Unselect all: clear your selection.
-
-
Select the destination page to apply the action.
Customize the default behavior of a tile
Each tile represents the data and configuration of a Report as it was created in Data Query: content, name, description, graphical representation, options, and so on.
In some cases, it can be useful to modify the default behavior of a tile by overriding some of the elements of the Report. For example, you can display a title and graphical representation that are more suitable for the content of the Board you are currently creating.
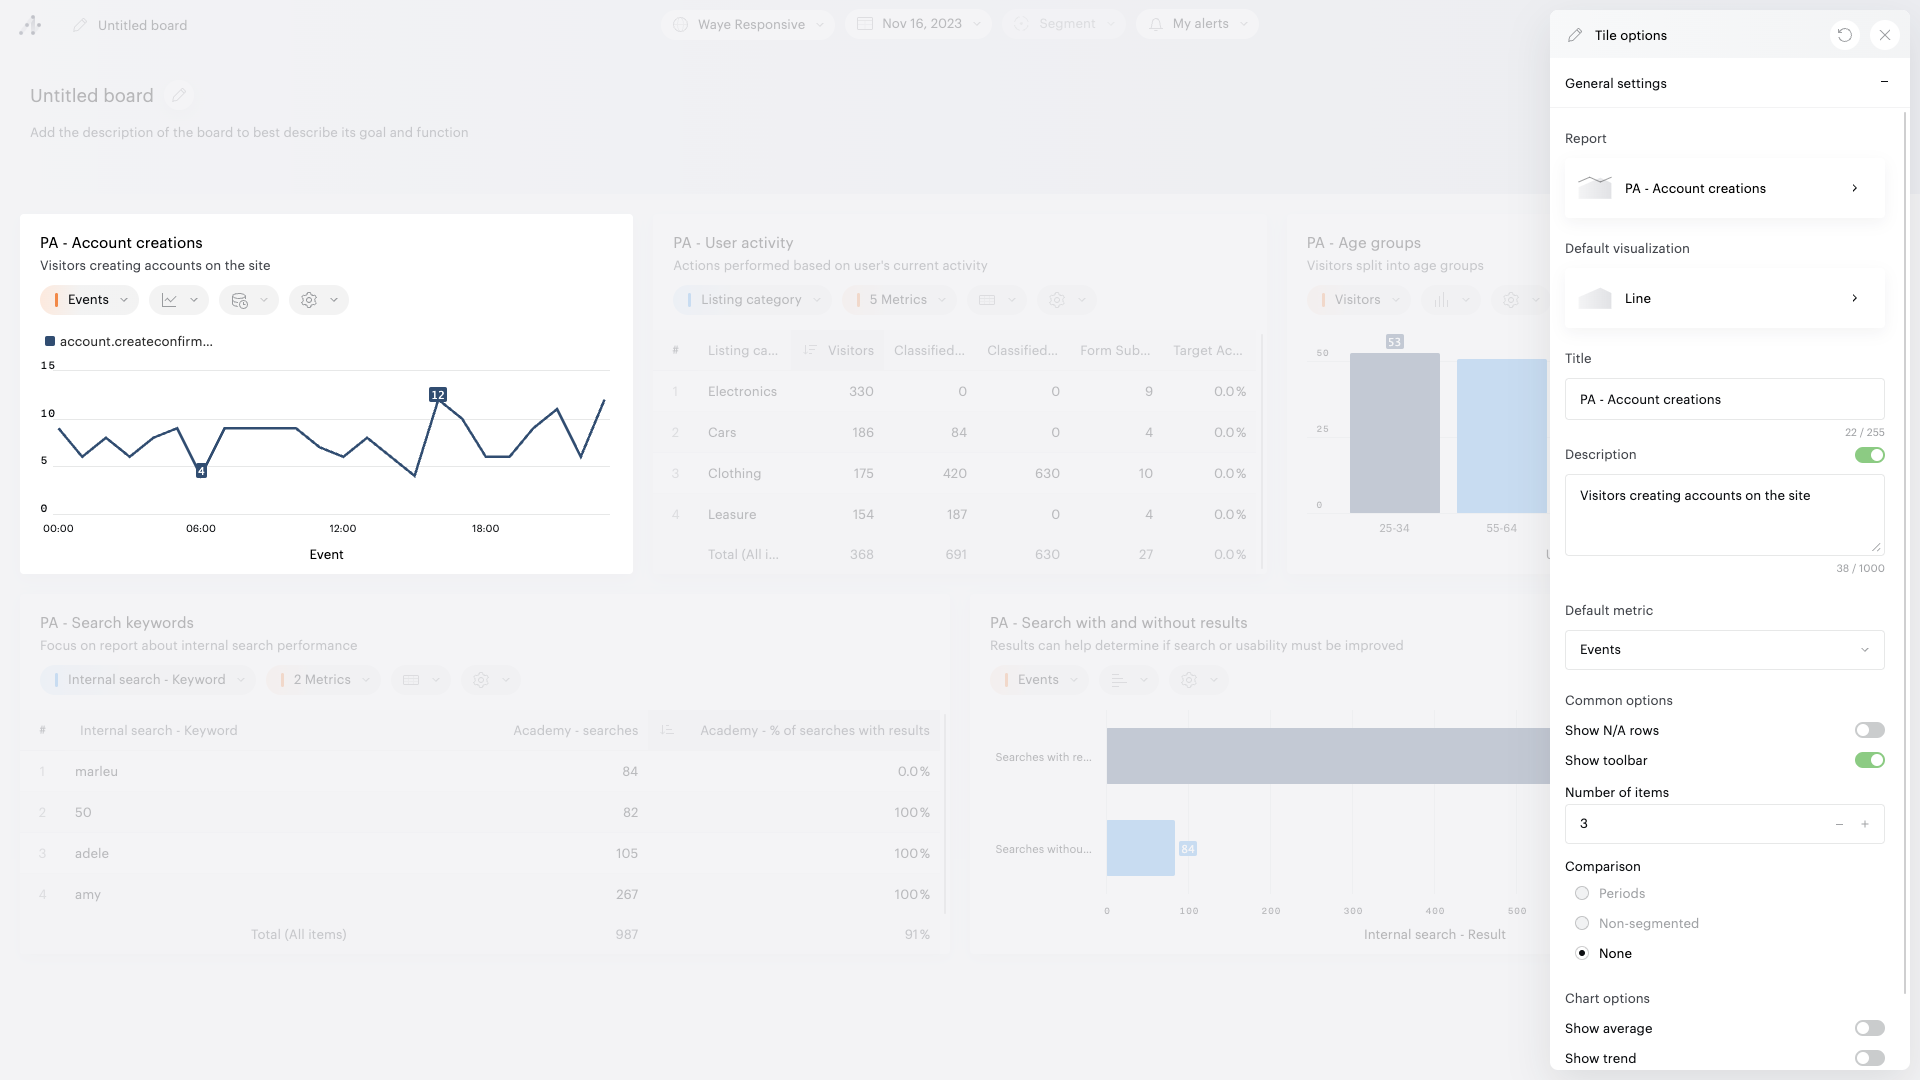
To customize your tiles, you must first switch to edit mode. Then, hover over the tile you want to edit and click on the pencil icon to open the configuration panel.
With this panel, you can:
-
Override the title and name of the Report
-
Override the graphical representation of the Report
-
Select the metric/property to display by default
-
Create / select filters to apply by default
-
Override the number of items to display by default in the tile
-
Choose which page of results a table tile displays
-
Override the configuration of the chart options
-
Change the Report displayed in the tile
-
Set a fixed context so the tile always displays data for a specific site, time period, or both
-
Restore the tile to its initial configuration if you're unsure about your changes
-
Select the property on which to perform / delete a breakdown if the report contains several properties
On a table tile, Number of items and Page number work together: the first sets the page size, the second picks which page to show. Because the page number is set per tile, you can place the same report on a board several times, each tile showing a different page, instead of building a separate report for each.
Set a fixed context on a tile
By default, all tiles on a board reflect the site and time period selected in the board's context bar. Fixed context lets you override this at the tile level: a tile with a fixed context always displays data for a specific site, time period, or both, regardless of how other users navigate the board.
To configure it:
-
Go to the Context section.
-
Enable the Fixed context option and select the site, the time period, or both.
-
Save the tile settings.
Once configured, a lock icon appears next to the tile title. Hovering over it displays a tooltip indicating which dimensions are fixed (site, period, or both).
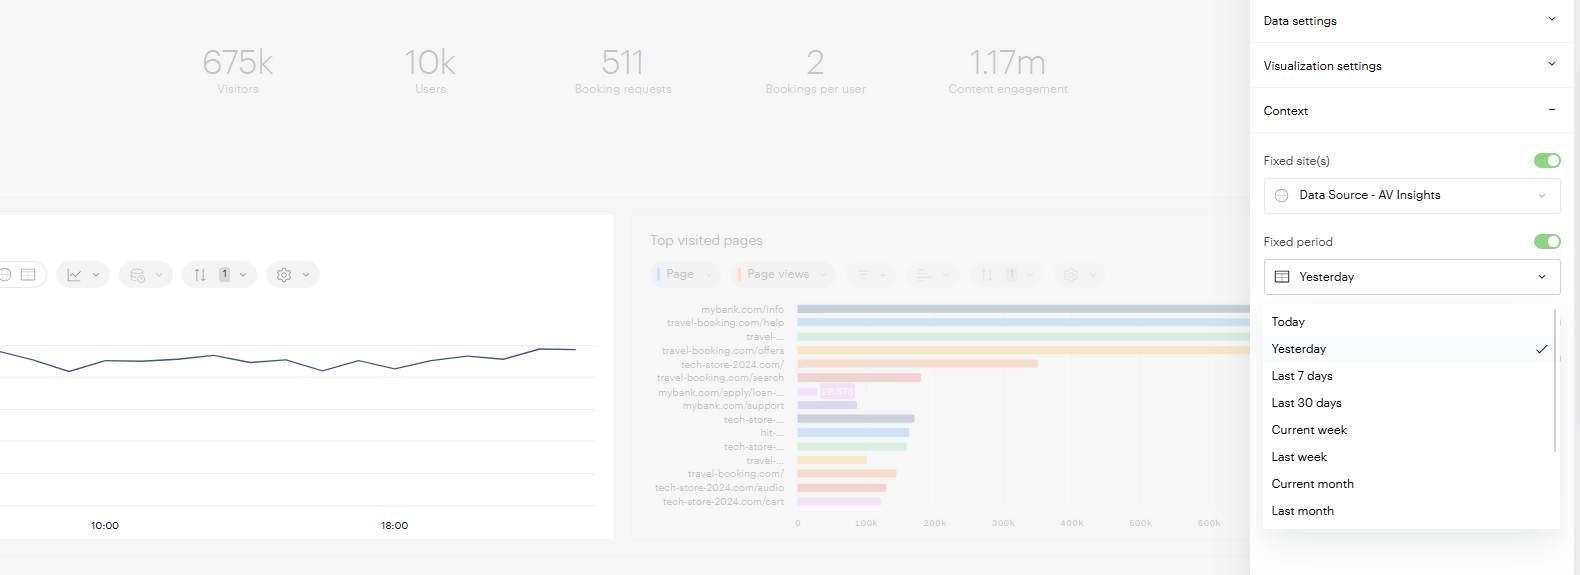
How fixed context interacts with the board context bar
When a user changes the site or time period from the board context bar, tiles with a fixed context are not affected, they keep displaying data for the scope defined by the author. Tiles without a fixed context update normally.
Delete a tile
To delete a tile, hover over it and click on the trash icon.
Organize content across pages
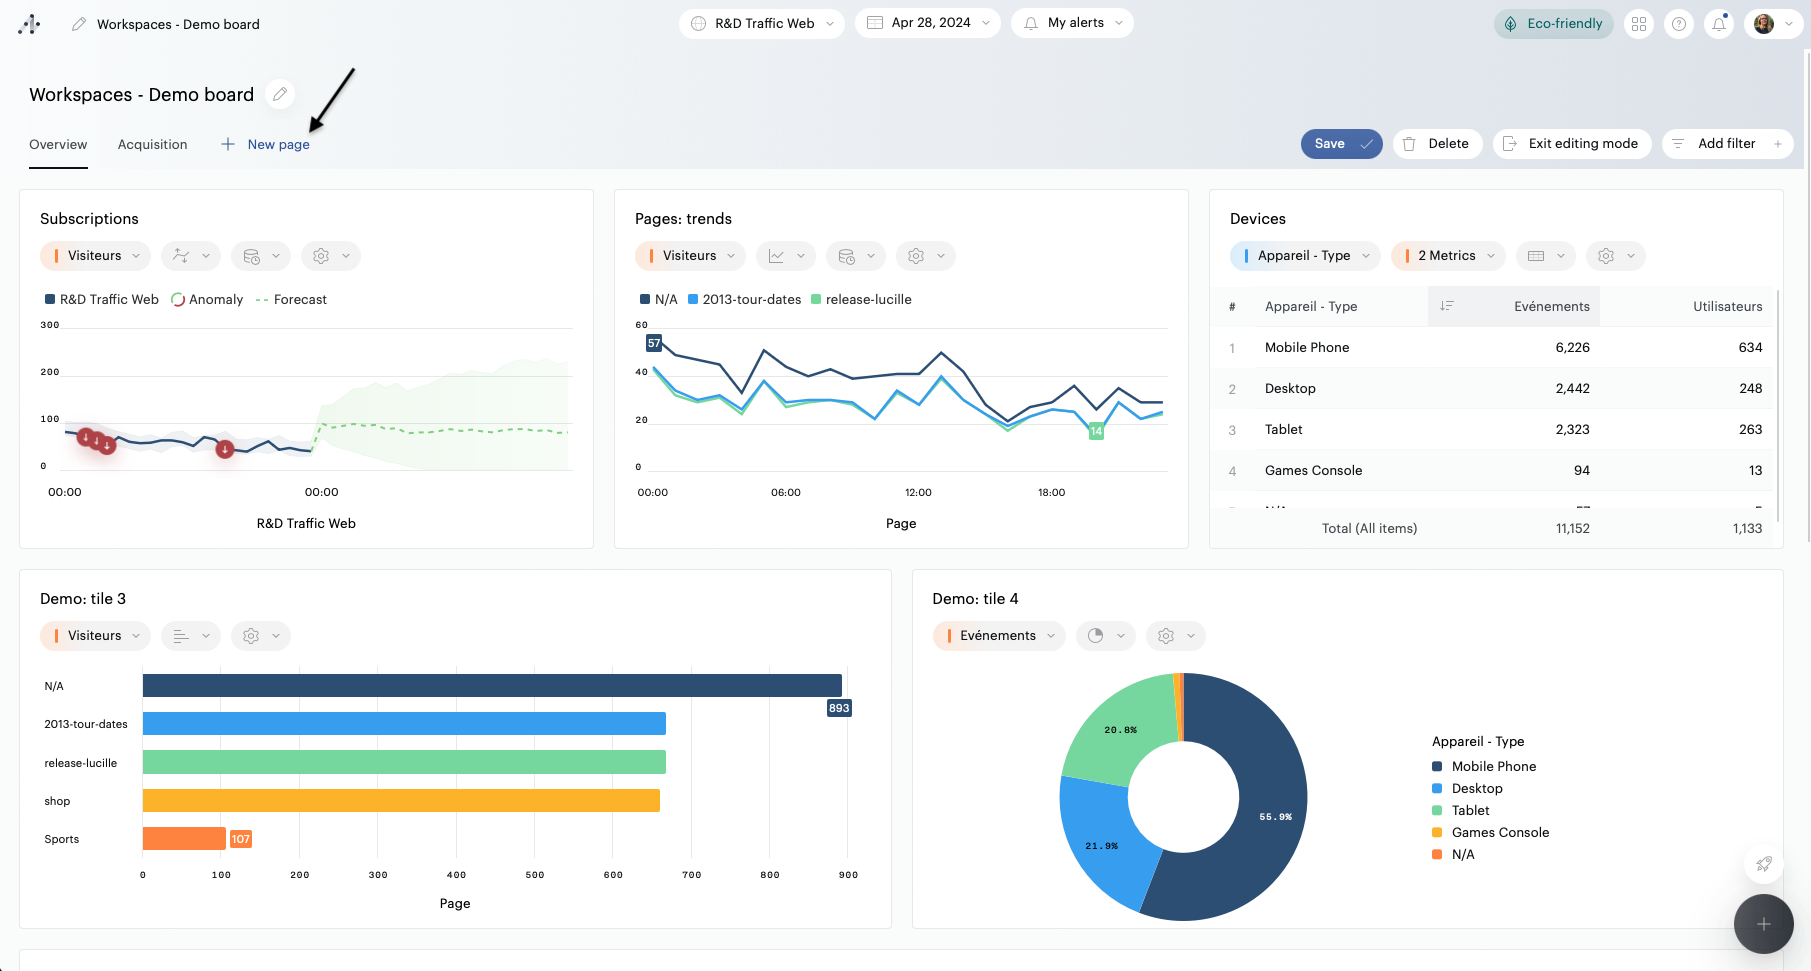
You can distribute the content of your board over several pages.
-
To create a page, enter the edition mode, and click the “New Page” button below the Board's name and description.
-
To rename, duplicate or delete a page, hover over its name, then click on the "..." that appears.
-
To reorder pages, drag a page's name to the position you'd like to display it and drop it.
Good to know
-
You can add up to 10 pages to a board.
-
A page name must contain at least 4 characters and no more than 50.
-
If you delete a page, all its tiles are deleted.
Configure board settings
Name and save the board
Click on the pencil to the right of the board title to give it a name and a description. The description is optional:
-
Use it to describe the board, present its contents, give reading instructions, and so on.
-
If you don't want to display the description on the board, deactivate it. The description is still used to describe the board in the Library.
Change the color palette
You can change the color palette that will be used by default on your board: click on the pencil to the right of the board title, and activate the Custom colors toggle. You can then choose one of the preset palettes.
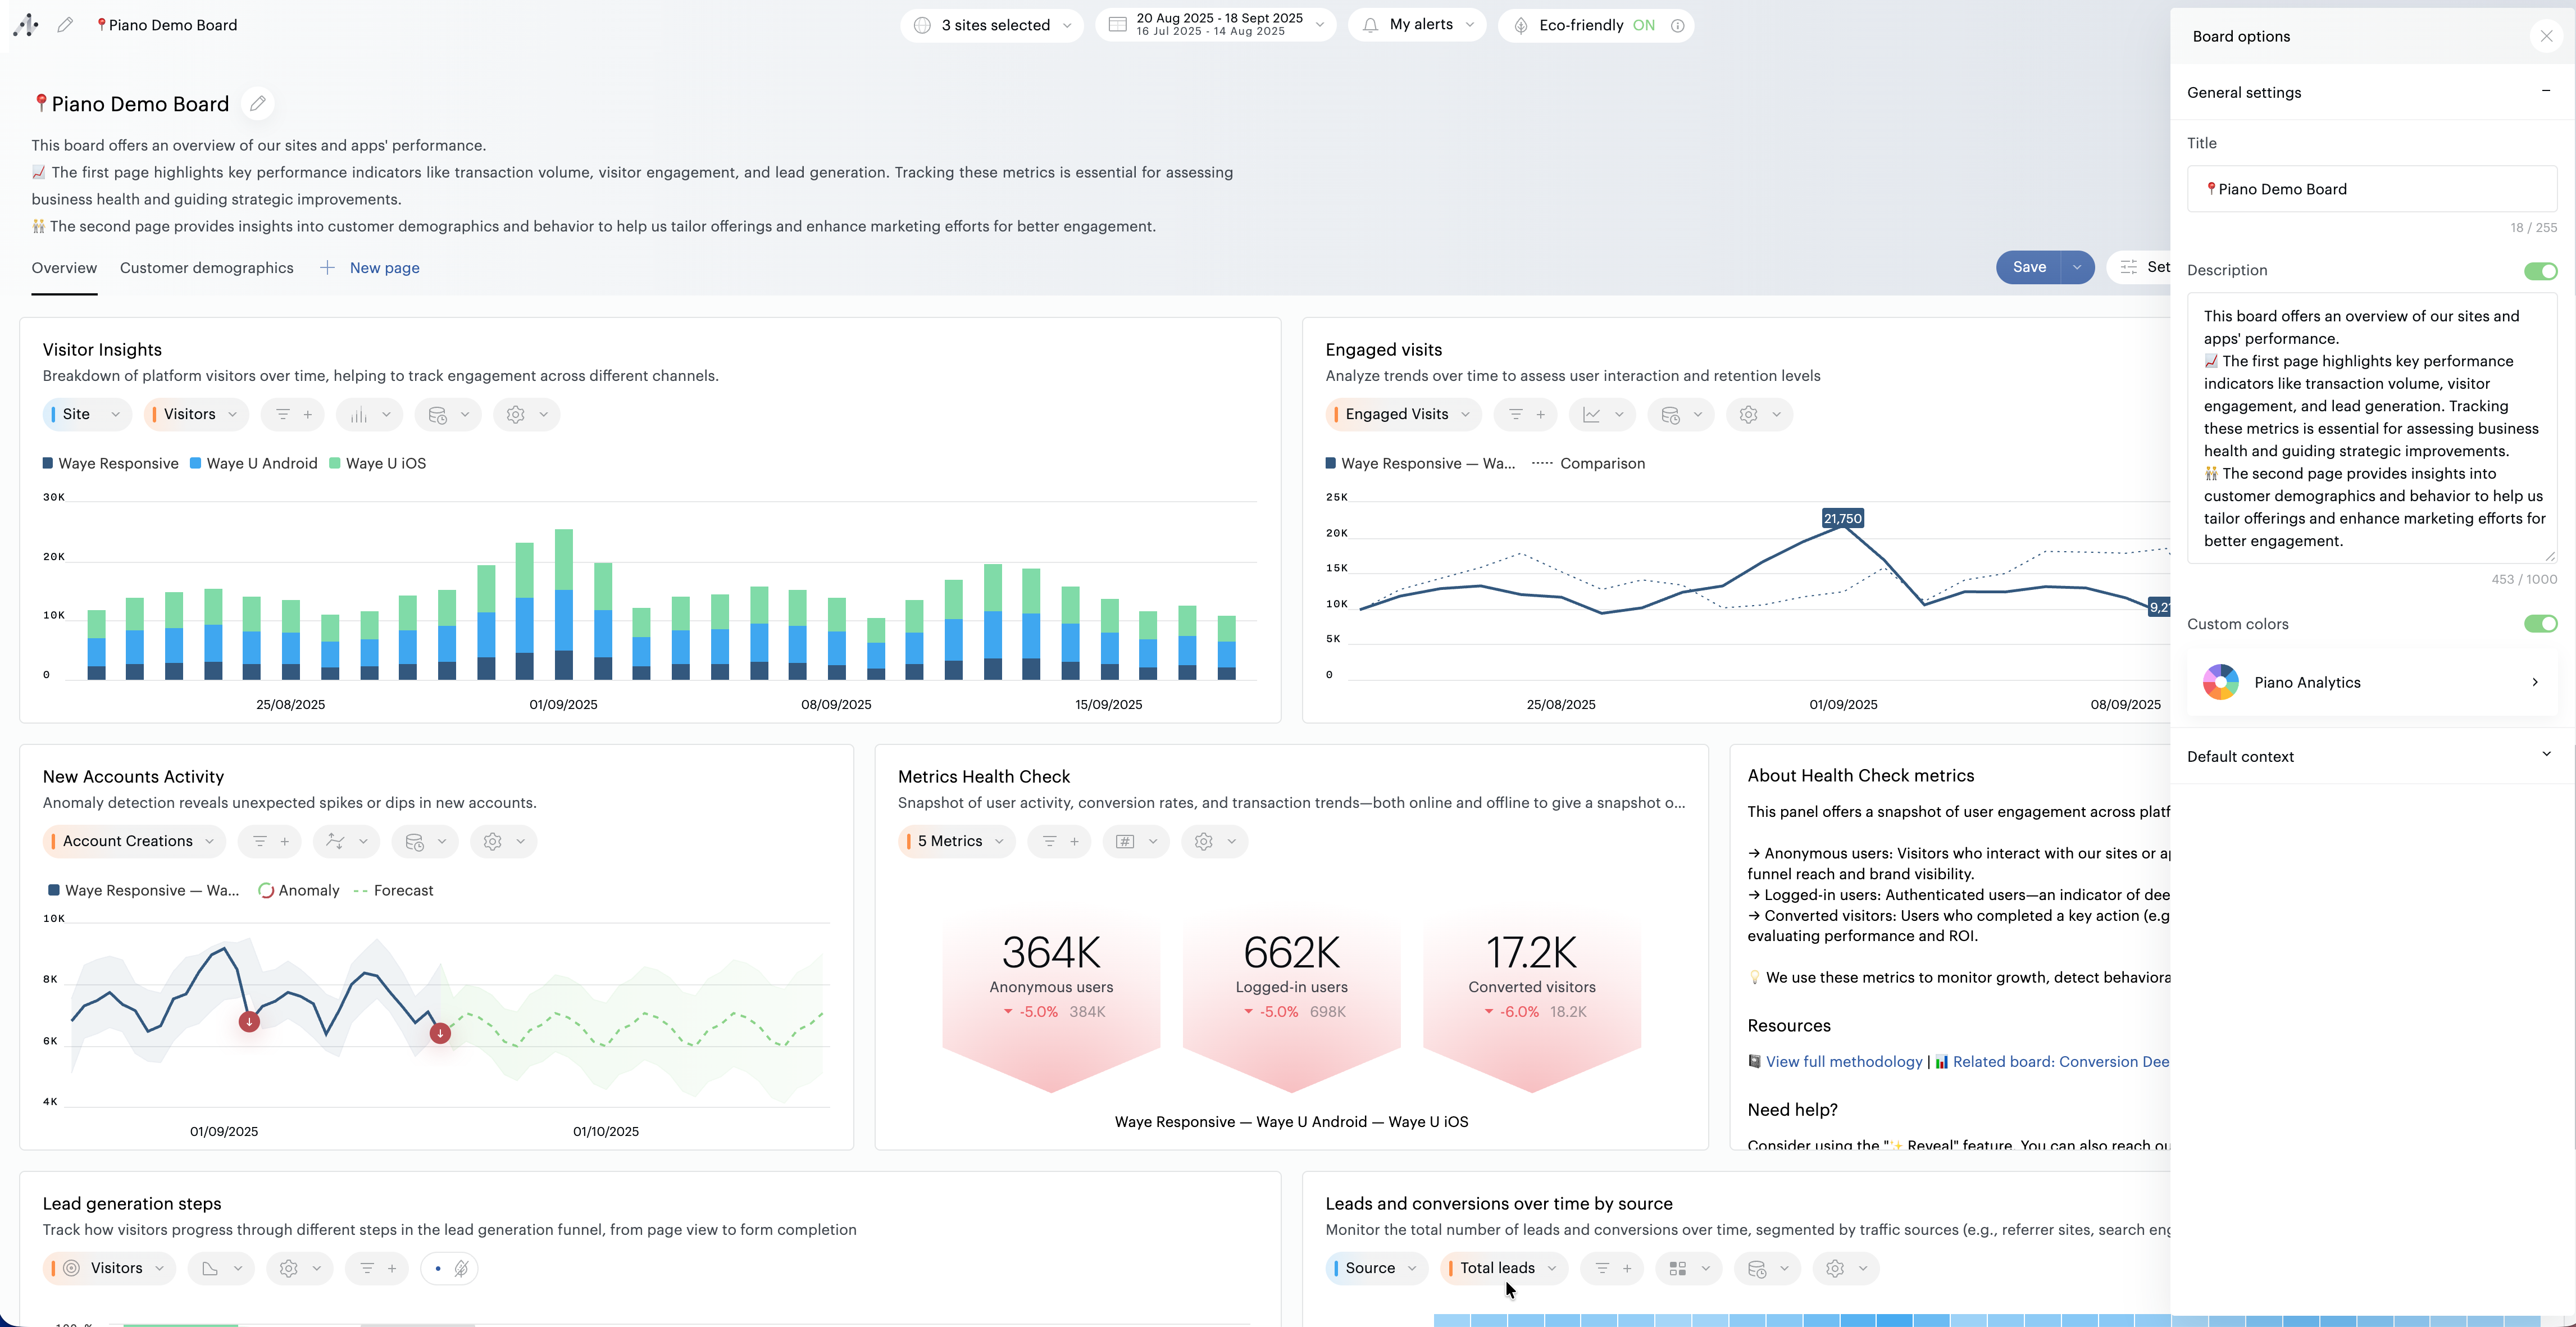
Users with no editing rights can also choose one of the preset palettes, on the fly. When such an action is made, the setting is not saved.
Configure custom default settings
If you don’t configure any specific settings, the board will open using the user's default site, the Yesterday time period, with comparison disabled, granularity automatically adjusted to the selected period, and no preference set for eco mode.
To ensure consistent interpretation and save time for all users of a board, you can redefine the default settings yourself:
-
Site to use
-
Time period to apply (including custom relative periods)
-
Comparison status (enabled / disabled)
-
Granularity for evolution charts
-
Eco mode status (undefined → respects the end user’s preference / enabled / disabled)
These settings will be automatically applied each time the board is opened, avoiding the need for manual reconfiguration. You can set them from the "Board Settings" menu, available in the board’s toolbar.
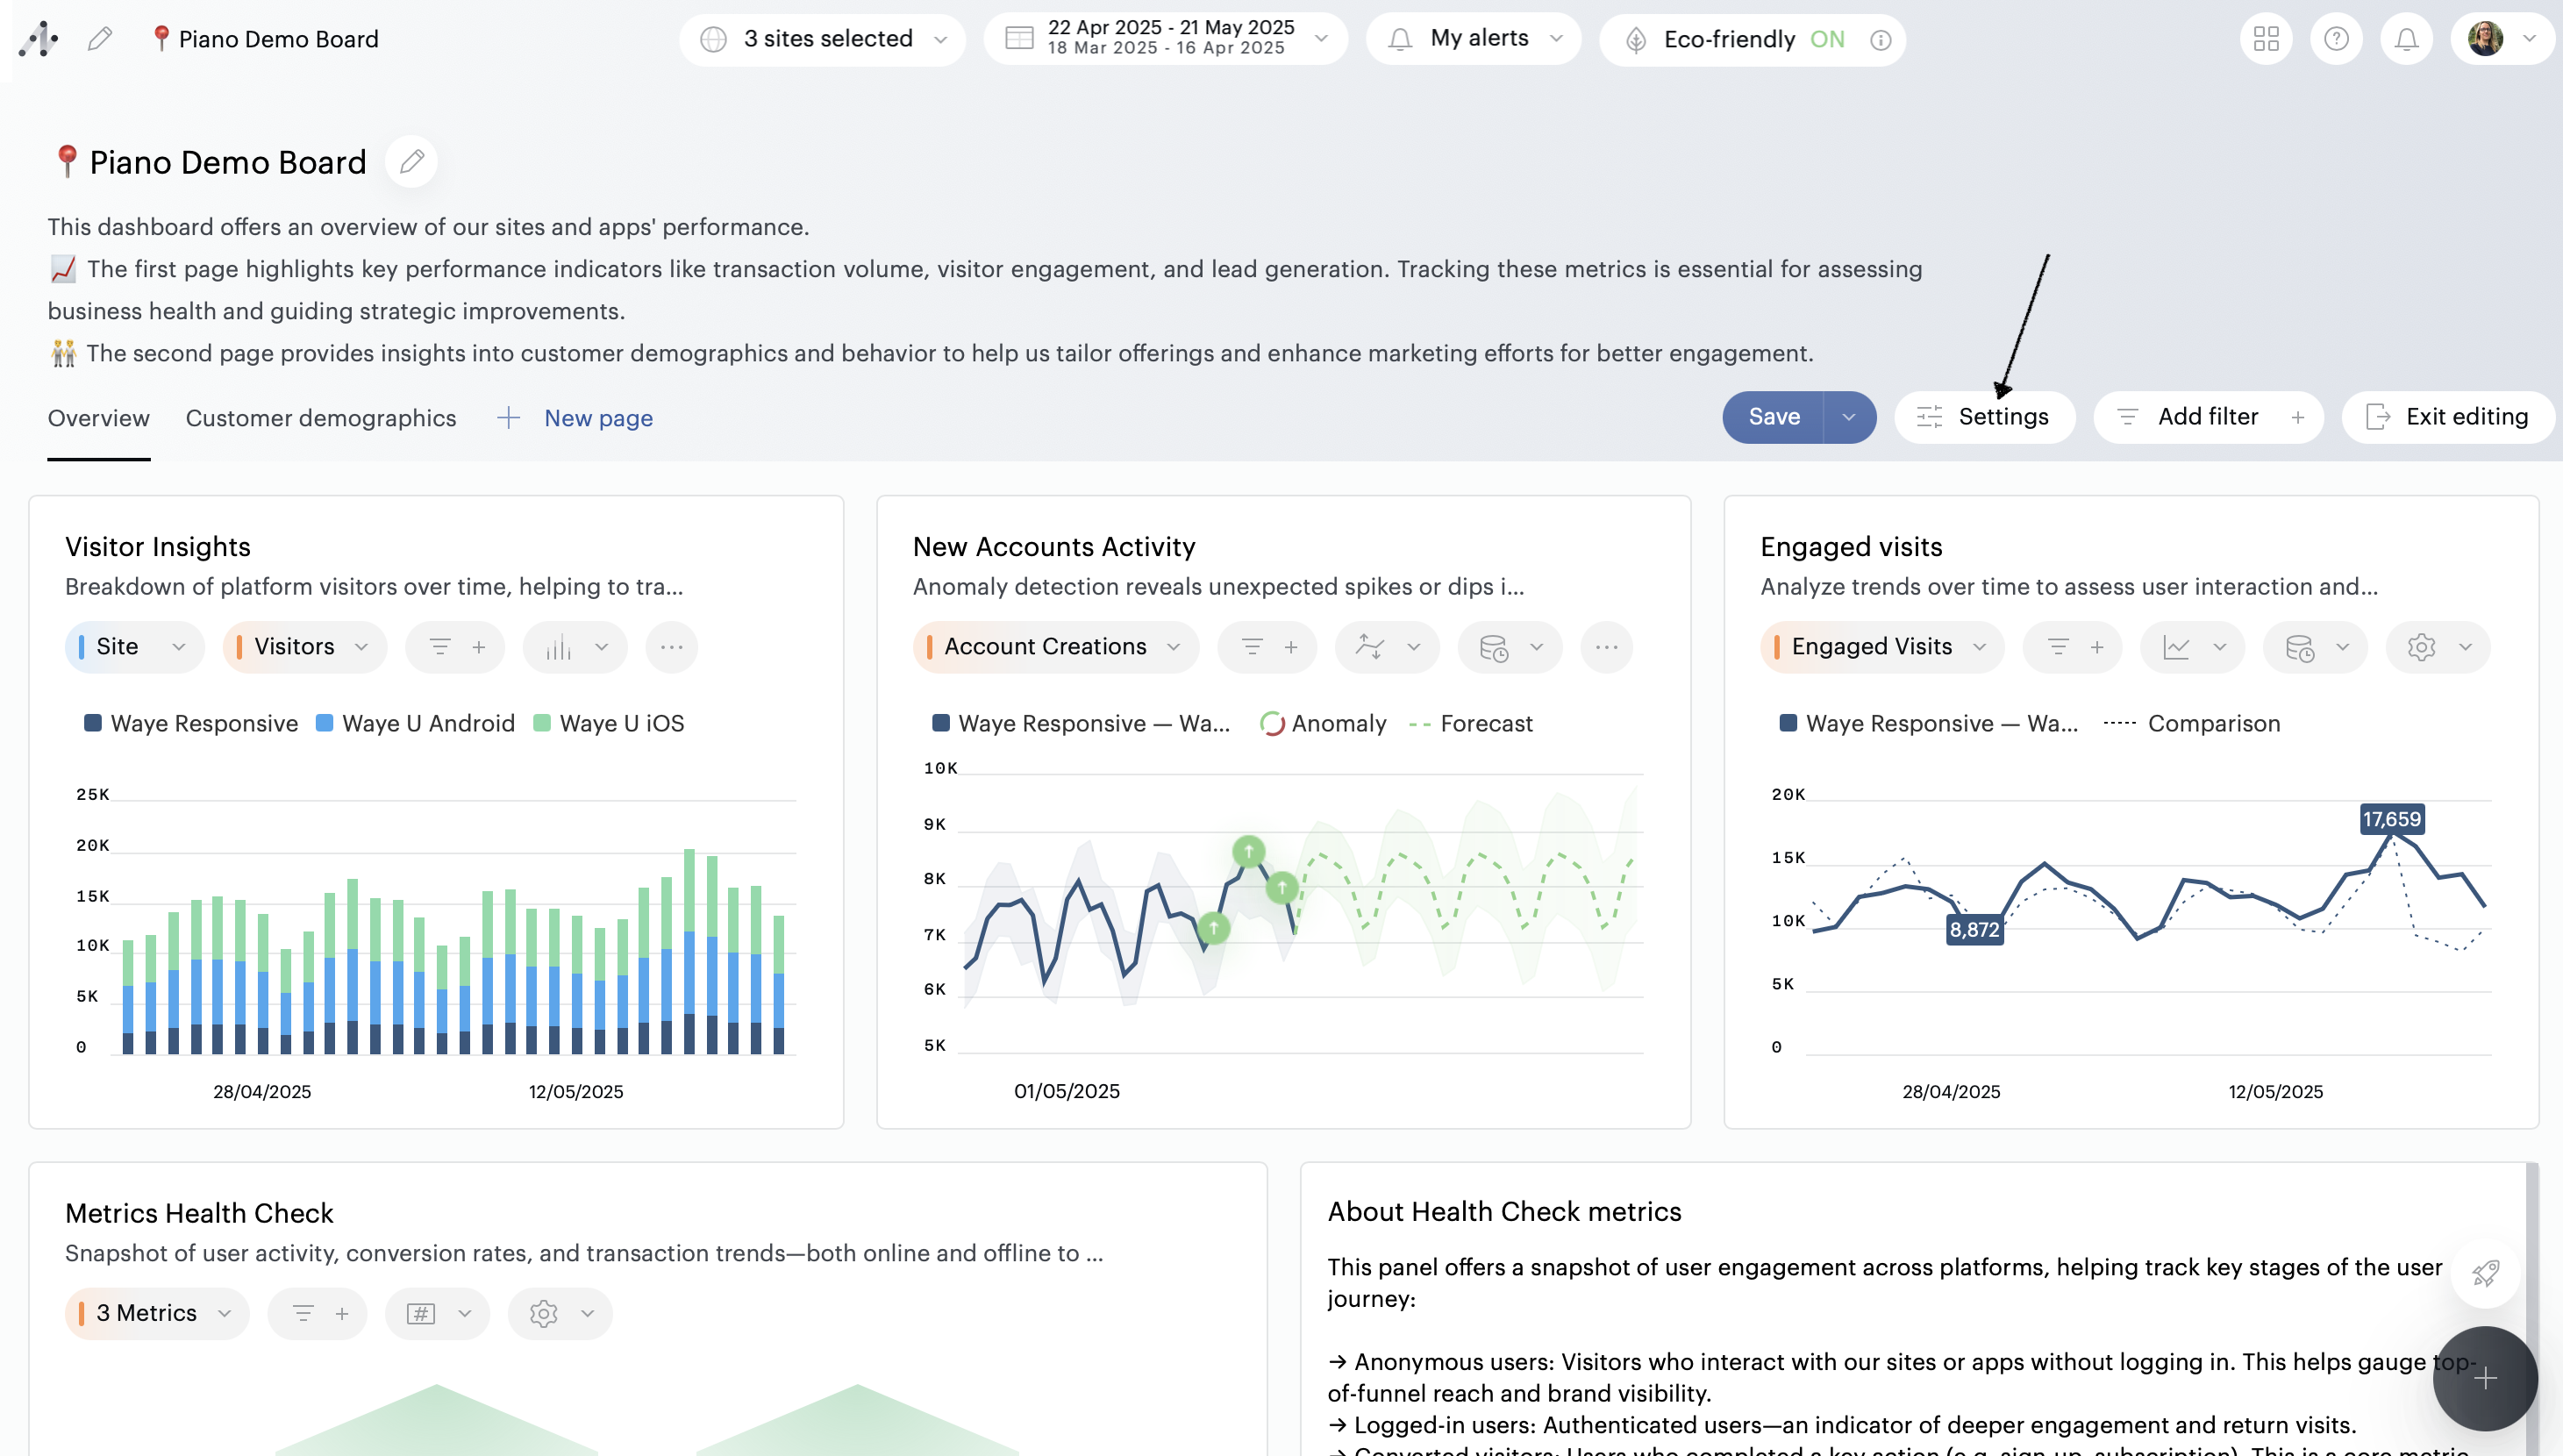
To enable automatic refresh by default, create and save a custom relative time period that includes automatic refresh. Then select this period when configuring the board’s default settings.
Customize property and metric names
By default, a board displays property and metric names as they are defined in the Piano Analytics data model. From the Board settings, you can define custom display names for any property or metric used in the board, so it speaks the vocabulary of its audience, whether you are building dashboards for analysts, marketers, or executives.
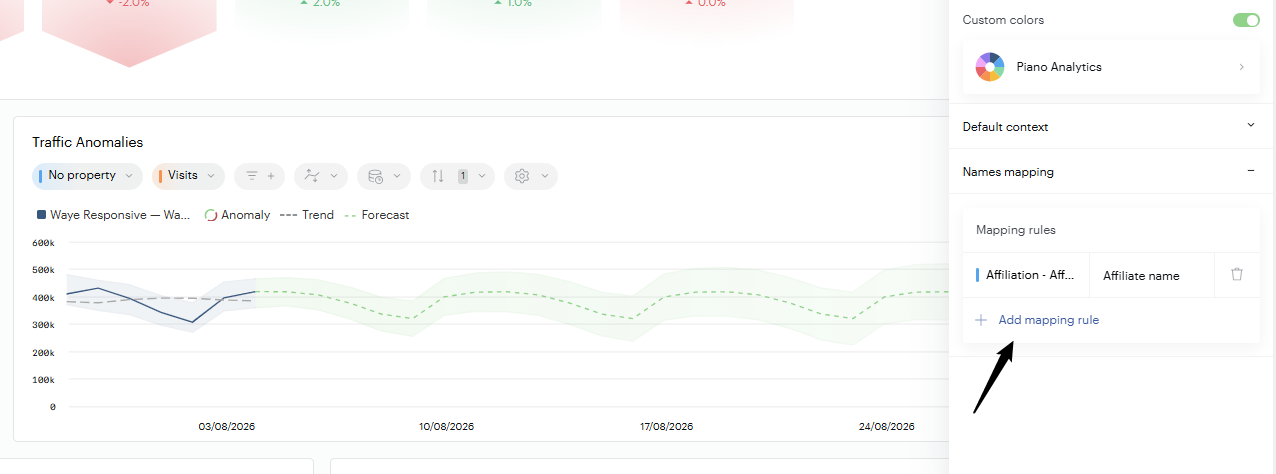
You set custom names in the Names mapping section of the Board settings. Each mapping rule associates an original Piano Analytics property or metric name with a custom name of your choice.
To add a custom name:
-
Open the Board settings and expand the Names mapping section.
-
Under Mapping rules, click Add mapping rule.
-
Select the property or metric you want to rename, then enter the custom name to display.
-
Save the board.
To remove a custom name, click the trash icon next to its mapping rule.
Once saved, a custom name applies consistently across the whole board: in tiles, filters, the customization drawer, and fullscreen view.
Good to know
-
Custom display names apply to this board only. They do not change the underlying data or the original names in the data model.
-
If you open a tile in Data Query, the original property and metric names are displayed, not the custom names.
-
Reveal, Piano's AI, also uses your custom names when generating narratives, so AI-generated insights read in the same vocabulary as the rest of the board.
Save the board
At this stage your board is not yet saved. Close the title and description editing window, then click the Save button.
The board is now listed in the Library, by default as a private resource. After each save, the board switches to view mode.