
Developer Debugging Tools and How to Access Them
In order to begin debugging your Piano implementation within your own browser, you need to access the developer tools. Here’s how you can go about doing so for a few common browsers:
Chrome - Chrome DevTools - Chrome Developers
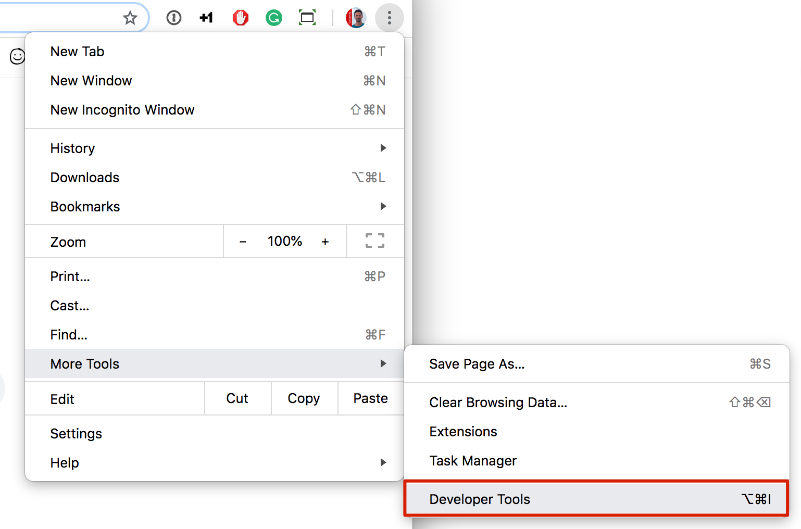
To open the developer console in Google Chrome, open the Chrome Menu in the upper-right-hand corner of the browser window and select More Tools → Developer Tools. You can also use the shortcut Option + ⌘ + J (on macOS), or Shift + CTRL + J or F12 (on Windows/Linux).
Firefox - Firefox DevTools User Docs — Firefox Source Docs documentation
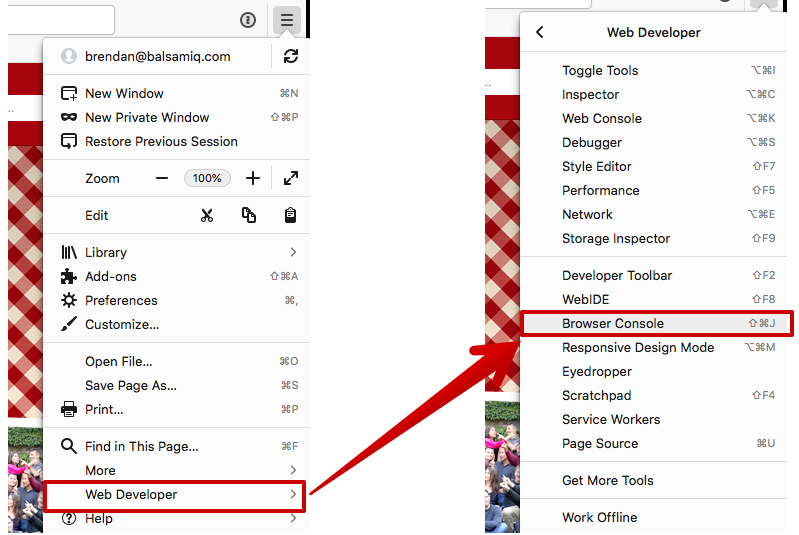
To open the developer console in Firefox, click on the Firefox Menu in the upper-right-hand corner of the browser and select Web Developer → Browser Console. You can also use the shortcut Shift + ⌘ + J (on macOS) or Shift + CTRL + J or F12 (on Windows/Linux).
Safari - Tools - Safari - Apple Developer
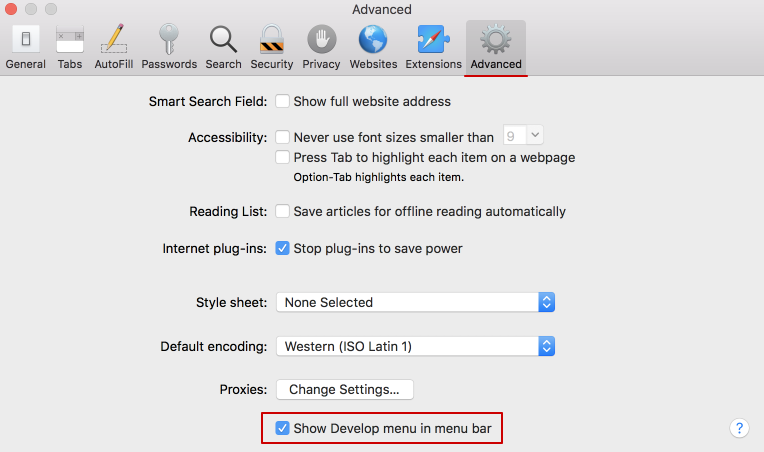
Before you can access the developer console in Safari, you first need to enable the Developer Menu. To do that, go into Safari's preferences (Safari Menu → Preferences) and select the Advanced Tab.
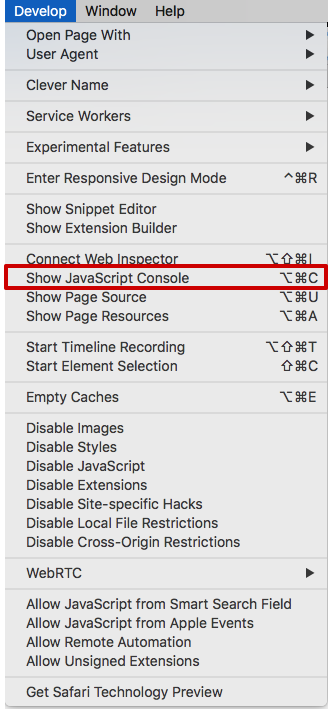
Once that menu is enabled, you will find the developer console by clicking on Develop → Show Javascript Console. You can also use the shortcut Option + ⌘ + C.
Edge - Overview of DevTools - Microsoft Edge Development
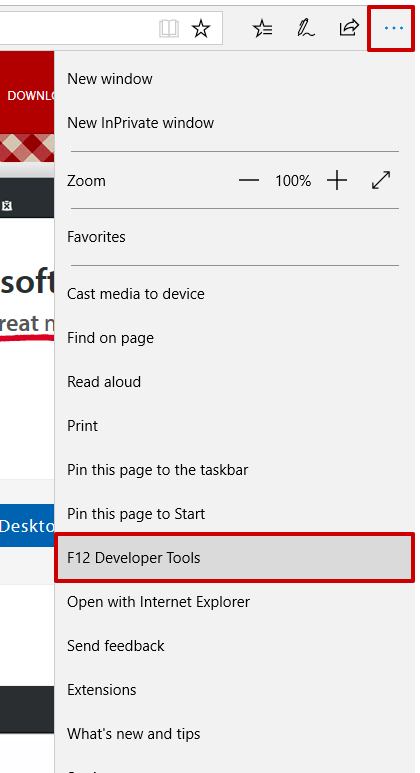
To open the developer console in Microsoft Edge, open the Edge Menu in the upper-right-hand corner of the browser window and select F12 Developer Tools. You can also press F12 to open it.
Opera - Explore advanced features
For Mac users, to open developer tools, select View → Show Developer Menu. A new submenu called Developer will appear on the menu bar. To use the tools, select Developer → Developer Tools.
For Windows and Linux users, to open developer tools, go to O Menu → Developer → Developer Tools.
Console Functions
When you open the developer tools in your browser, you gain access to a range of console commands that can help you examine the current status and values of Piano functions, as well as verify the connection between your site and Piano.
As a client utilizing Piano's script on your website, it is essential to have a clear understanding of how to debug experiences effectively. Debugging can help identify and resolve any issues or inconsistencies that may arise during the implementation or runtime of Piano's features. We will explore various debugging techniques using developer tools, such as Console functions, checking the environment, identifying the running experience, and utilizing the dev tools for reviewing Composer Experience flows. By following these steps, you can gain valuable insights and troubleshoot any problems swiftly.
Environment/Application Commands
The Console tab within the developer tools serves as a powerful resource for debugging. Here are a couple of helpful console functions:
1. Check AID using tp.aid
To determine the AID (Application ID) running on your website, follow these steps:
-
Open the developer tools and navigate to the Console tab.
-
In a new line within the Console, type:
tp.aid -
The AID associated with the Piano integration script will be displayed.
2. Check Environment
To identify the environment (Prod US, EU, AP, AU, or Sandbox) being used, utilize the following console functions:
-
tp.getExperienceEndpoint(): This function returns the request URL of the environment (such as https://sandbox.tinypass.com for Sandbox or https://dashboard.piano.io for US Production or https://dashboard-eu.piano.io for EU Production, etc.). -
tp.isSandbox(): Returnstrueif the environment is Sandbox andfalseif it is a Production environment.
Login Status Commands
-
tp.pianoId.isUserValid(): This command checks the login status of the (Identity Management) user. If the response istrue, the user is logged in; iffalse, the user is not logged in. -
tp.pianoId.getUser(): Executing this command provides detailed information about the logged-in user, such as their email, UID, name, and more. This can be valuable for debugging user-related issues. -
tp.externalJWT: Use this command to retrieve the JWT (JSON Web Token) of the user for Identity Linking. The JWT token contains authenticated user information and can be useful for debugging authentication-related problems. -
tp.userRef: By executing this command, you can obtain the userRef token associated with the user. The userRef token serves as a unique identifier for the user and can be helpful for troubleshooting. -
tp.pianoId.logout(): This command allows you to log out the currently logged-in (Identity Management) user. -
tp.externalAuthCookieName: Returns the name of the HttpOnly cookie used for Identity Linking authentication, if configured. This is used when implementing HttpOnly cookie mode for enhanced security.Example:
tp.externalAuthCookieName
// "piano_auth_token"
Note: When using HttpOnly cookie mode,
tp.pianoIdLite.getToken()will returnnull. This is expected behavior, as the JWT is stored in an HttpOnly cookie and is not accessible to JavaScript for security reasons. To verify authentication status in HttpOnly mode, use:await tp.pianoIdLite.init(); console.log(tp.pianoIdLite.isUserValid());
Checking Page Level Data
In addition to login-related information, you can use console commands to inspect page-level data provided to Piano. Here are a few commands to help you with that:
-
tp.tags: This command provides you with the tags associated with the current page. Tags help categorize and organize your content, allowing for more targeted monetization and personalization strategies. -
tp.contentAuthor,tp.contentCreated,tp.contentSection: These commands retrieve meta-tagged content information available on the current page. You can extract details such as the content author, creation date, and section to gain insights into the context of the displayed content. -
tp.customVariables: Use this command to access the custom variables defined on the page. Custom variables enable you to attach additional data to your Piano implementation, providing flexibility for advanced segmentation.
Debugging Via Web-based Developer Tools
Below we will explore how you can leverage web-based developer tools to investigate and debug experiences effectively, helping you identify and address any issues that may arise.
Please also refer to this page on how to validate if Piano scripts are properly executed.
Follow these steps to get started:
-
Open the developer tools in your browser.
-
Navigate to the "Network" tab within the developer tools.
-
In the Network tab, type "Tinypass" into the search box. If no entry is found, try "Piano" as well. This will result in filtering the network requests to display only those related to Piano's script.
Ensure that the network tab is open before refreshing the page. You may need to refresh the page while the network tab is open to view the results.
Investigating Request Details
Upon filtering the network requests, you will see multiple requests related to Piano. To determine which experience triggered the offer shown, click on the request that contains "/checkout/offer/show". In the "Headers" tab, you will find a long request URL containing parameters that can assist in debugging. Here's a sample URL structure:
https://sandbox.tinypass.com/checkout/offer/show?displayMode=modal&templateId=OTDKTCUTXMPL&offerId=OFPRLHTJMQPB&experienceId=EXT3FMFYYK29&...
The bolded portions in the URL represent the template ID, offer ID, and experience ID, respectively. This information is valuable when investigating and troubleshooting specific experiences.
Inspecting the Offer Template
Another approach to finding the Experience ID is by using the Inspect tool on the Offer template (inline or modal). Follow these steps:
-
Right-click on the Offer template displayed on the page.
-
Select the "Inspect" option from the context menu.
-
This action will open the developer tools with the "Elements" tab selected.
-
Scroll to the top of the site until you locate the iframe ID. The iframe URL will contain the same information mentioned above, including the experience ID.
User Segmentation Debugging
To further investigate the targeting logic within the Composer Experiences, you can utilize the Network tab in the Developer Tools. Follow these steps:
-
Access the Network tab in the developer tools.
-
Search for "execute" within the Network tab.
-
Refresh the page that contains the experience you want to investigate.
-
Look for the response: "execute?aid=YOURAIDHERE".
-
Click on the response to delve into further details about the experience firing on that page.
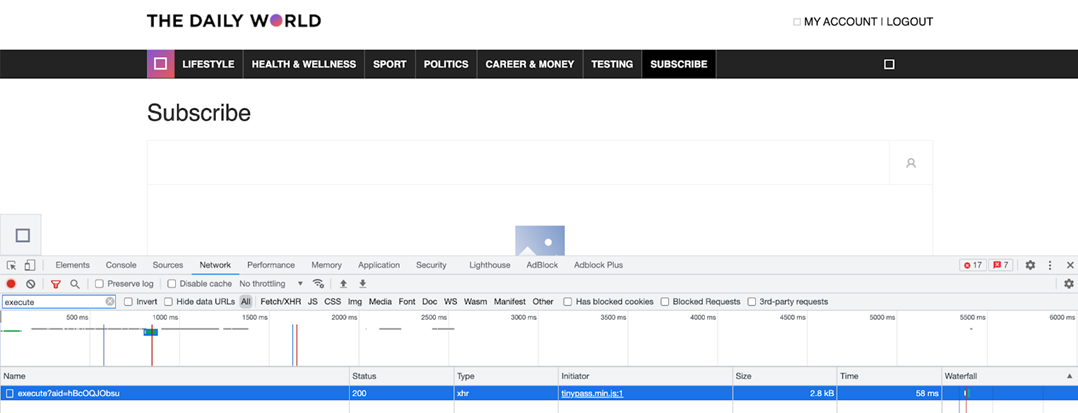
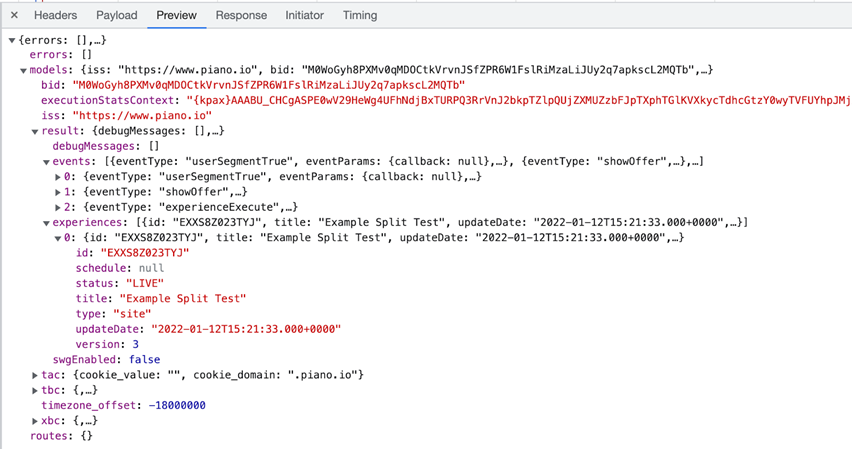
Within the response, you can explore the Preview tab, which provides insights into the events, user segmentation, and other details about the experience currently firing.
You can click through Models → Result → Events to view the events in the experience as well as user segmentation and Result → Experiences to view details about the experience currently firing:
Enabling Debug Mode
Utilizing a "Debug Mode" can offer further debugging capabilities. Here are the steps to enable debug messages in the Network tab:
-
Append "?xpdebug" to the end of any URL on your website that is running Piano scripts
This addition allows you or your developers to see the debug messages in the Network tab.
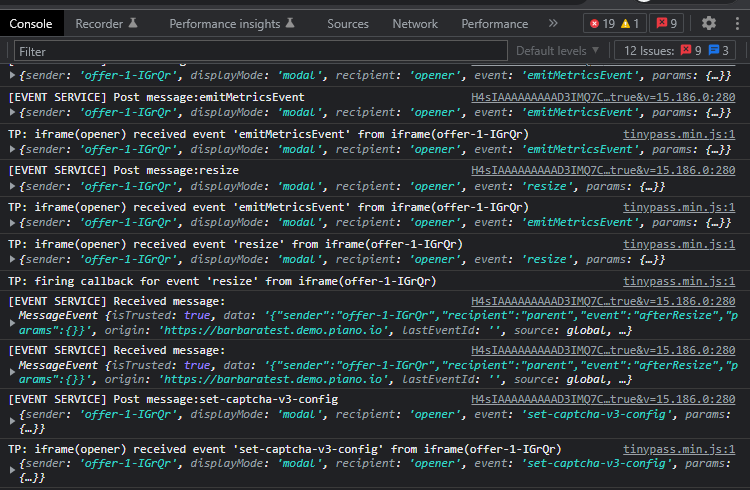
Alternatively, you can enable debug mode by adding the following code snippet to the console:
tp.push(["setDebug", true ]);
Note: You may need to add this code as an override to your script or re-trigger the Composer Experiences by adding tp.experience.execute() after running the code in the browser's console.