
Overview
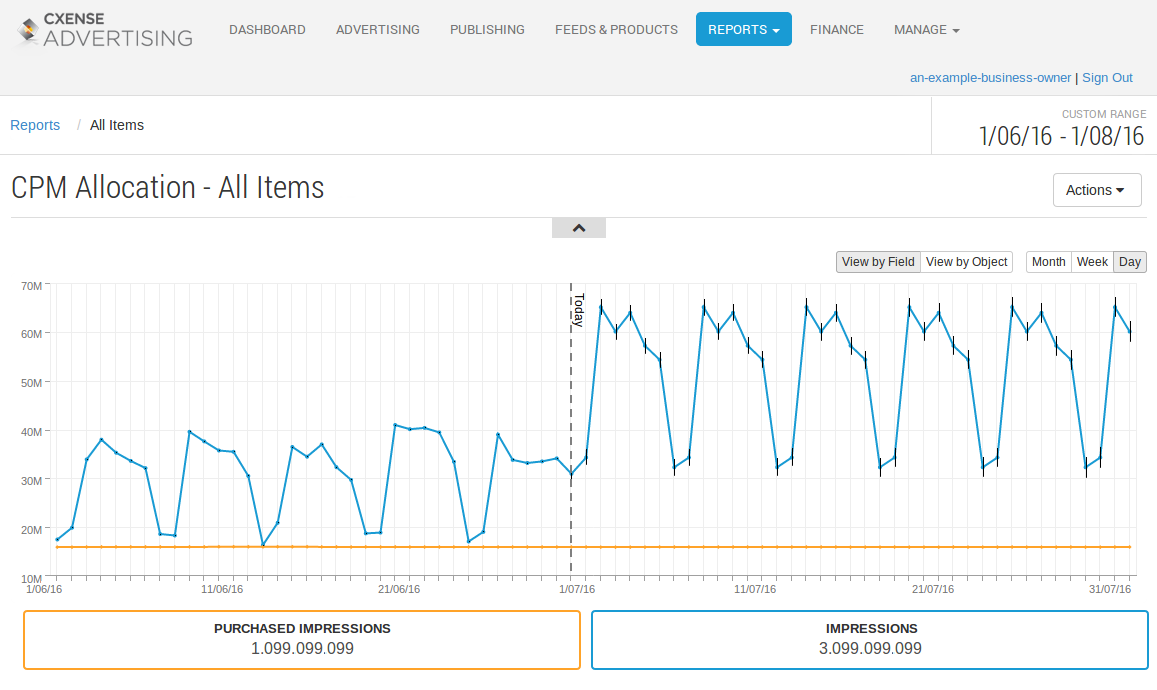
This report provides a summary of the allocated impressions for all CPM Products within your platform.
The report provides a single place to view both:
-
The number of impressions that have currently been allocated (i.e. sold via contracts) for the product(s); and
-
The number of impressions that the product(s) receive, including:
-
historical statistics on the number of impressions received in the past
-
forecast data for the predicted number of impressions that will be available in the future
-
The forecast impression-counts are generated using an automated algorithm that uses the products' recent history to learn traffic patterns and produce future predictions. The impression forecasts provide an estimate of the number of impressions that could be served if the fill rate for every presented ad space was 100%.
Please note: the CPM Allocation Report is specific to CPM Products, and therefore will not show any CPC or Tenancy Products.
Controlling the Date Range of the Report
The date-range selector in the top-left corner of the page controls the reporting period. A number of quick-links are included, based upon frequently used future time ranges:
-
tomorrow,
-
the next 7 days,
-
the next 30 days,
-
this month, and
-
next month.
Custom date ranges, including historical dates, can also be selected.
If a selected date range covers both past and present dates, then a vertical dashed-line – labelled Today – is displayed in the report to indicate the current date (as shown in the example report above). In this case, it is important to understand that:
-
all reported impression data to the left of the line is based upon historical statistical data, and
-
all reported impression data to the right of the line is based upon forecast data.
The forecast data are displayed with error-bars to make it clear that these numbers are based upon predictions. The smaller that the error-bars appear, the more confident the system is in its prediction of the future impression counts.
Please note: the forecast impression counts may show a relative increase in comparison to the historical impression counts (as shown in the example report above). This behaviour is to be expected, as the forecasts are based upon a best-case-scenario where the presented ad spaces always have a 100% fill rate. Therefore, if the historical impression counts are lower than the forecast impression counts, this would indicate that your ad spaces have not been fully utilising the space available to them.