
You can't get an exact number, but you can estimate it. When a visitor opts out (Visitor mode = "optout"), no visit or visitor ID is generated, in line with GDPR, so only the events are counted. To estimate the number of visits or visitors, divide the number of opt-out events by the average number of events per visit (or visitor) among the visitors you do track.
A visitor who refuses cookies in your consent banner is not automatically in opt-out mode. With the consent exemption, they are in exempt mode and their visits and visitors are counted as usual. Opt-out applies when a visitor explicitly refuses tracking, typically from your privacy policy page.
Calculate the average number of events per visit or visitor
Data Query automatically excludes opt-out events, so this average is based on your opt-in and exempt traffic.
-
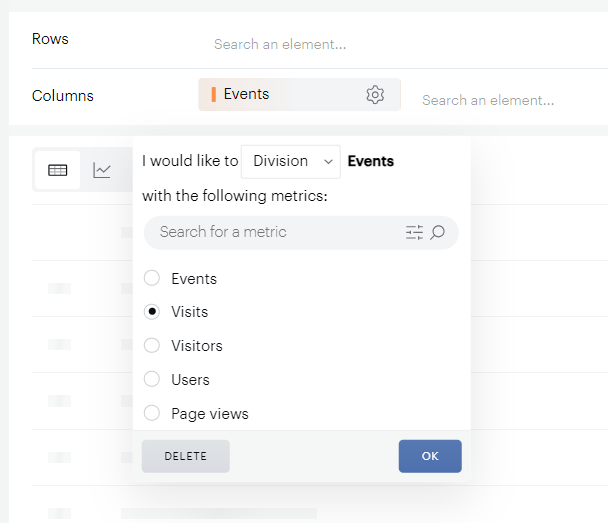
In Data Query, add the Events metric to your analysis.
-
Click Create metric.
-
Select Division, then choose Visits or Visitors as the second metric.
-
Confirm.
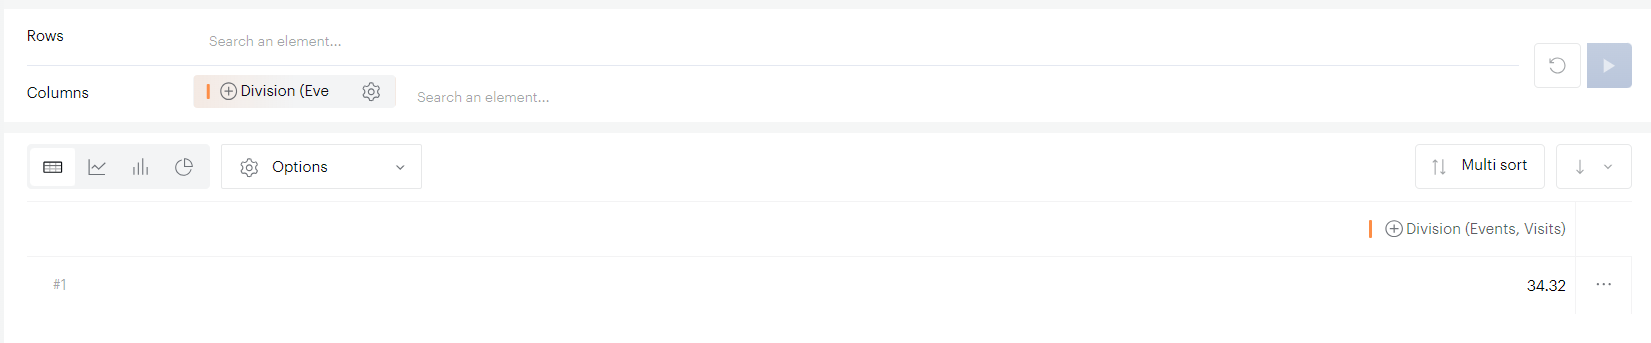
In this example, the average is 34.32 events per visit.
Count the opt-out events
-
Create a new report with the Visitor mode property and the Events (all) metric.
-
Filter the property on the "optout" value.
In this example, 538 events were generated in opt-out mode.

Data Query excludes events with Visitor mode = "optout" from standard analyses to comply with privacy regulations. Use the Events (all) metric to see them, because it includes every event, even those excluded from standard analyses.
You can also read the number of opt-out events in Explorer, under Audience > Privacy, in the Exclusion tab.
Estimate opt-out visits or visitors
Divide the number of opt-out events by the average you calculated:
538 / 34.32 = 15.7
In this example, about 16 visits were in opt-out mode over the analysis period.
This is an estimate. It assumes that visitors who opt out behave like the visitors you track, so use it as an order of magnitude rather than an exact figure.