
Figures in Data Studio can differ from Piano Analytics because Data Studio recalculates and limits the data the connector sends. Check the cases below. If a table looks incomplete, see Row limit and sorting in Google Data Studio.
Visits and visitors totals
Visits and Visitors can't be summed. The "TOTAL" result line in Piano Analytics shows the deduplicated result, so the same visit or visitor isn't counted several times over a given time period, as detailed in this article.
Data Studio can't deduplicate this information, since the tool doesn't know the calculation Piano Analytics performs. It simply sums the rows, so it is likely to display larger values than Piano Analytics.
Time metrics
Time metrics such as time spent per visit are returned in milliseconds. To read them as a duration, click Add metric, then Add Field, divide the metric by 1000, and set the data type to Numeric > Duration.
Eco mode
Eco mode can lead to a maximum 2% difference in your results, in order to reduce the environmental impact of your queries. By default, it isn't active in an API call, so it has no impact on the results returned to Data Studio. When you compare figures, make sure eco mode is also deactivated in Piano Analytics.
Boolean properties
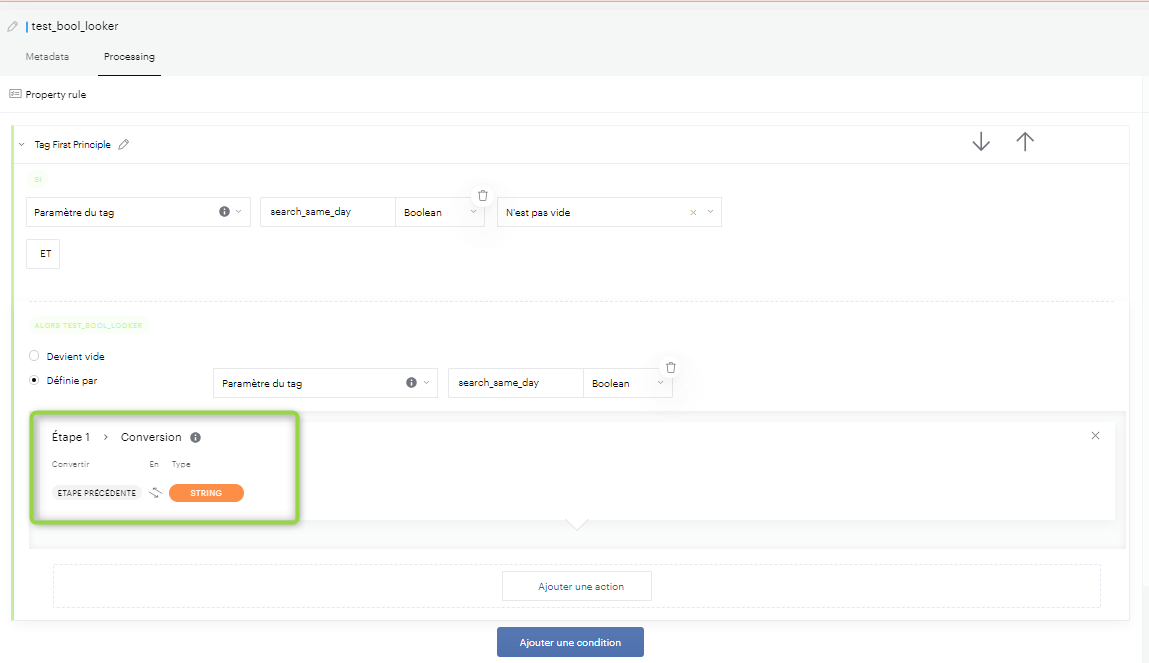
Boolean properties aren't compatible with the connector. To upload this information to Data Studio, ask an administrator to create a custom property that converts your boolean property into a string, as shown below with the "search_same_day" property. This change isn't retroactive.
Date properties
Data Studio reprocesses the date and time properties from Piano Analytics with its own function, sometimes in a different format. To avoid this, create a custom string property that keeps only the part you need. The steps below use the month as an example. You can repeat them for any time-stamped information in your events by changing the rule.
-
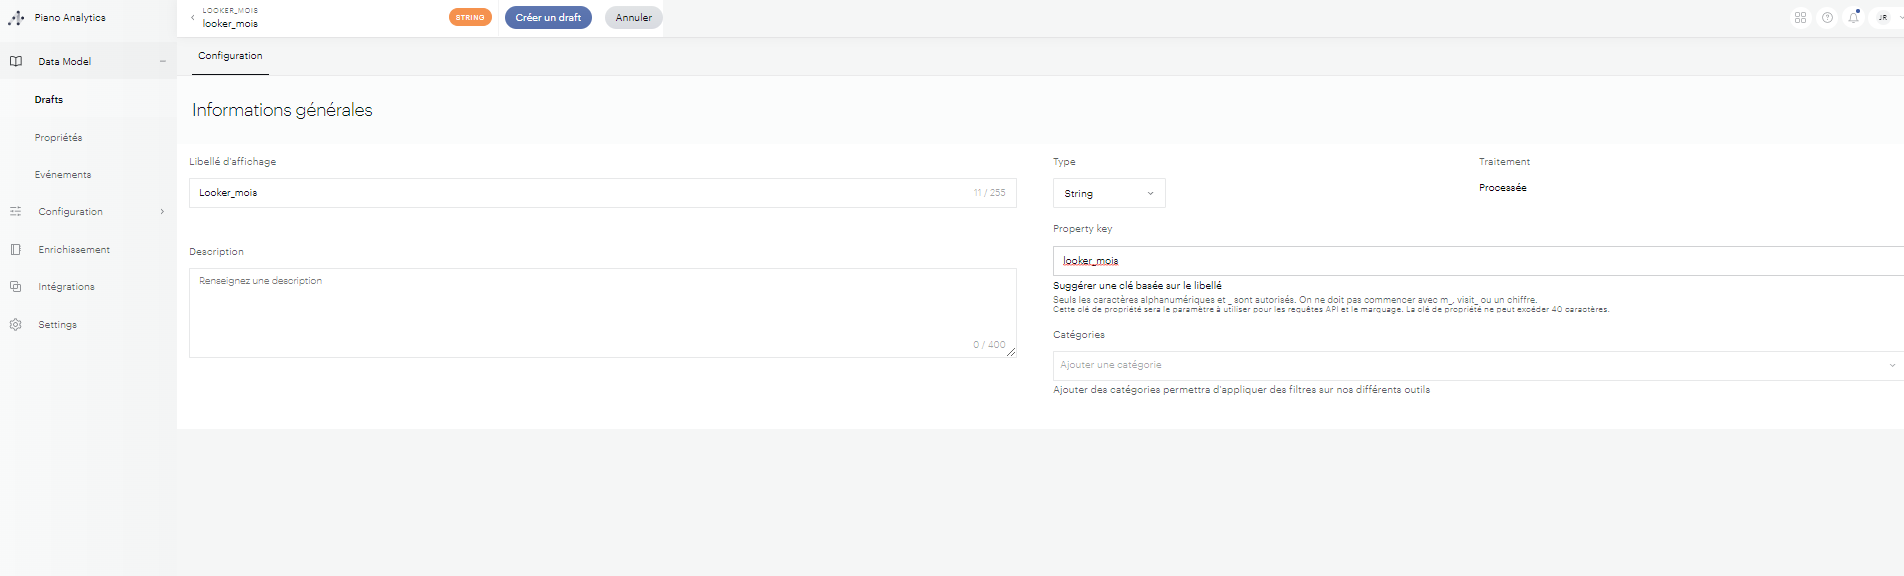
Step 1. Create your custom string property (for example "Looker_month") and validate your draft:
-
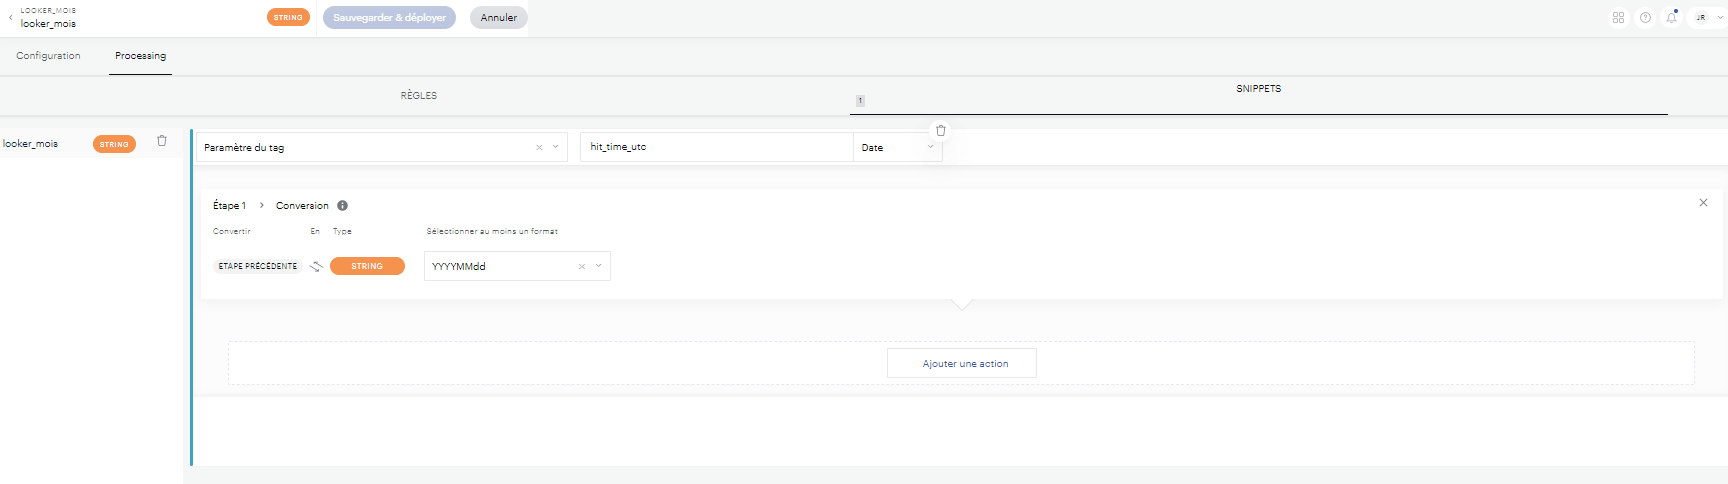
Step 2. Go to the configuration menu of this property, then Processing > Snippets, and create this snippet:
-
Step 3. Create this rule:
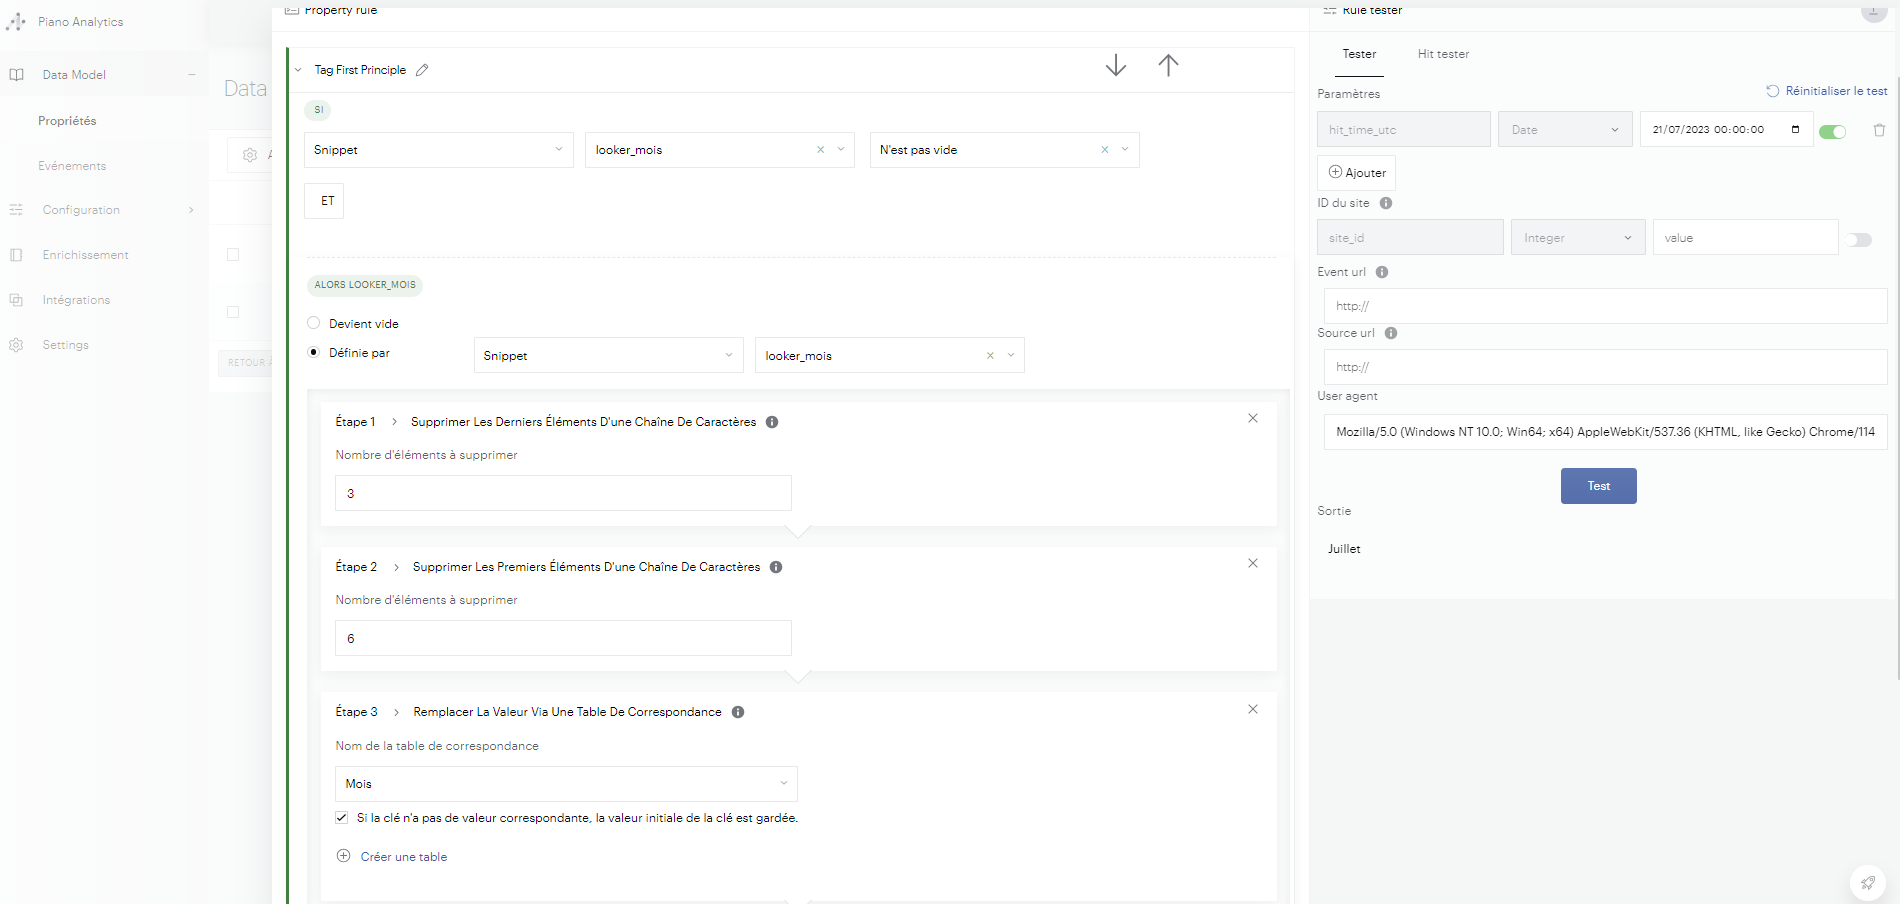
Before step 3, the property contains the month numbers (01, 02...). You can add a mapping table to get the real names of the months:
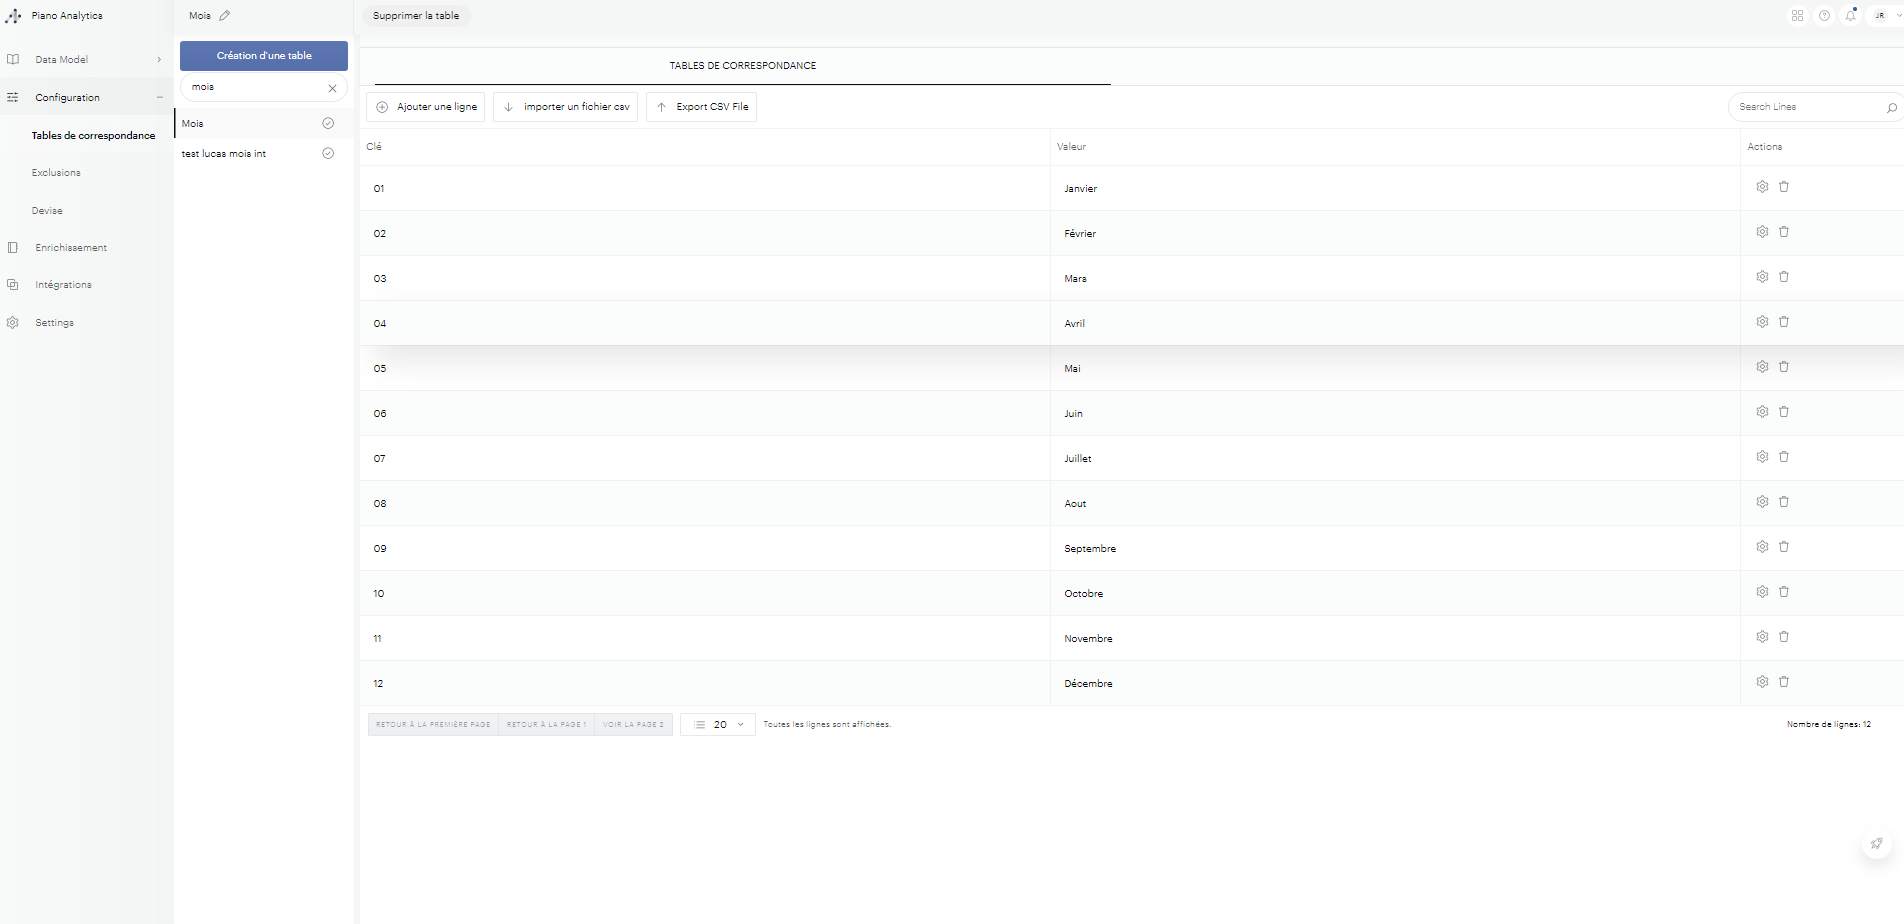
You can then use this property in Data Studio to obtain the correct month information.
String properties can't be used in Data Studio time charts, which require a date format. Native date properties may work for this type of chart.