
The Dashboard is a high-level reporting tool that displays analytics in customized time frames. The dashboard highlights key performance indicators by social account, service, or custom groups.
Account and Time-Frame Bar
The Dashboard displays data visualizations based on the account and dates selected in this bar.

The Account Picker
-
Click the service logo to toggle all accounts in that service
-
Click the number next to the service to toggle individual accounts from that service
-
More Options dropdown will allow you to select account groups
-
Note: Accounts Groups are managed on the Applications page in Settings.
-
The Date Picker
-
The presets give you a quick way to jump to a default time period that ends with the current date
-
The Calendar icon will allow you to set custom time frames
Queue
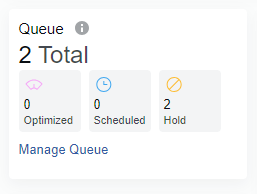
Your Content Queue stores content that is waiting to be published. You can add to your queue via RSS or other feeds. Messages in your queue may be optimized to publish when their AttentionScore™ reaches an ideal threshold; on hold waiting for further action, or scheduled to publish at a specific time. You can also compose and send messages right away.
Clicks
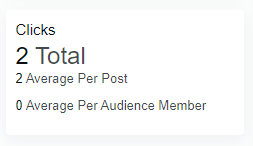
This measures clicks on all included posts as counted by SocialFlow. The clicks are also broken down per post and per audience member.
Interactions
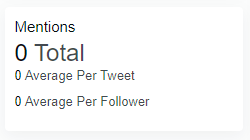
Interactions include retweets, mentions, comments, shares, likes and +1s of your content.
-
Note: This metric does not include LinkedIn Stats
Total Audience
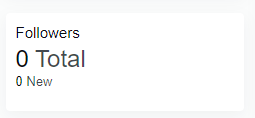
This metric aggregates followers from all selected social accounts.
-
Note: This metric does not include LinkedIn Stats
Visualizations
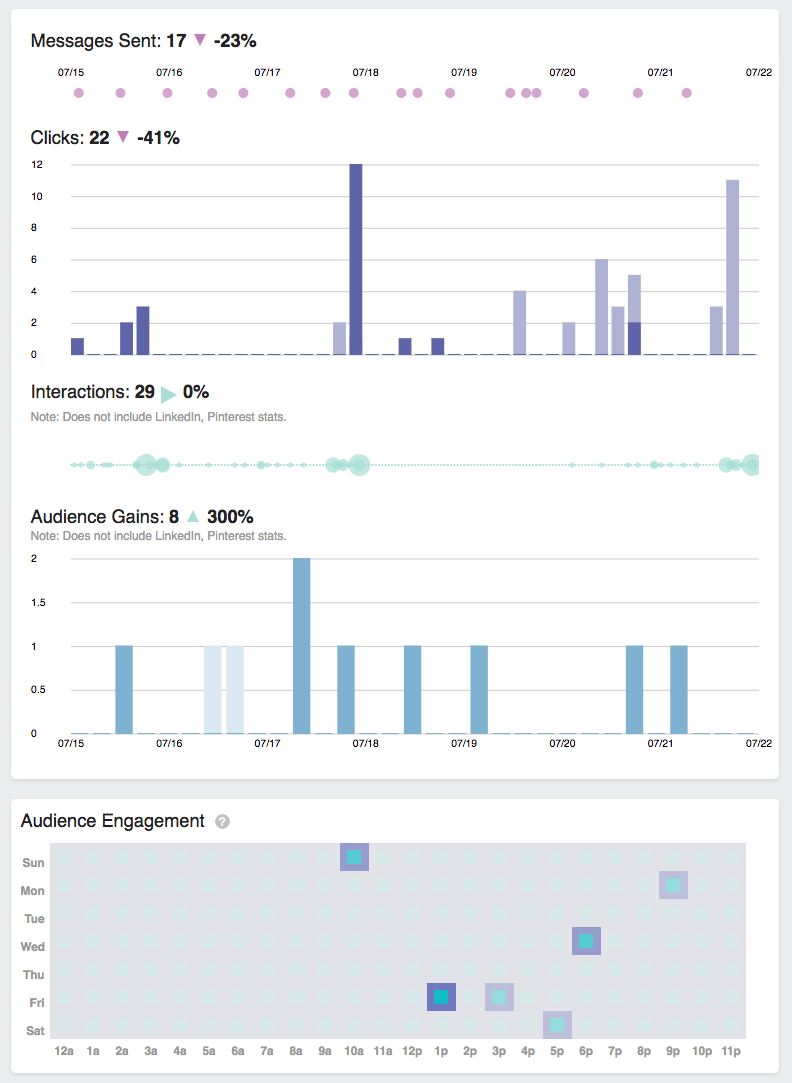
These infographics give you an aggregated view of your social metrics. The infographics will adjust as you make changes to the selected social accounts and to the date ranges.
-
Note: Hovering over any of the graphs will give you additional information about the published messages used to chart the graph.
-
Messages Sent offers a view of the messages sent from SocialFlow over the selected period of time
-
Clicks show you your clicks across the selected date range
-
Interactions aggregate audience interactions with your posts
-
Interactions include everything outside of the click: retweets, mentions, comments, shares, likes and +1s
-
Note: LinkedIn and Pinterest stats are not aggregated in this graphic
-
-
Audience Gains measure your follower increase over the selected time frame
-
Note: LinkedIn and Pinterest stats are not aggregated in this graphic
-
-
Audience Engagement is a heat map aggregated using clicks, mentions, retweets, likes, reactions, comments and shares