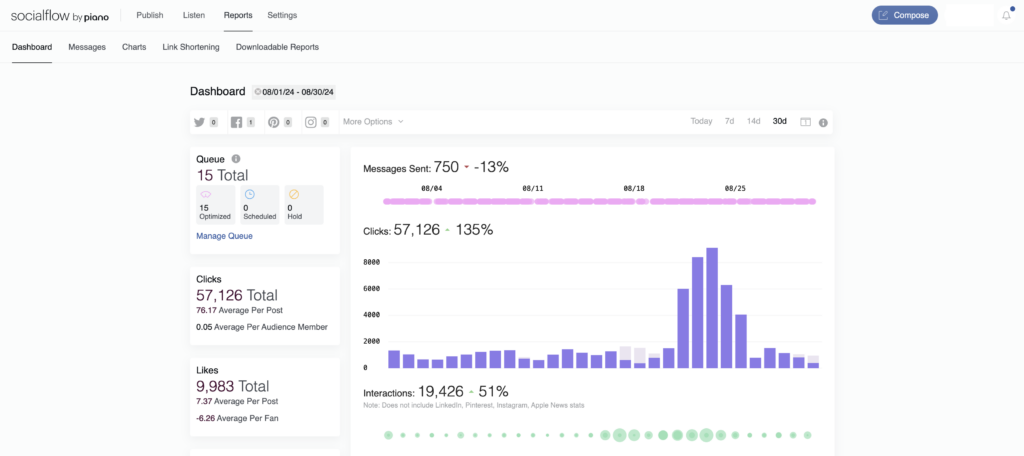
When you navigate to the main Reports tab, you'll land on the Dashboard page. You can customize your view by social network, date or date range, or filter by your predefined groups.
Reports: Dashboard Page
Key Data Points
Let’s break down what you’ll see when you navigate to your Dashboard.
Messages Sent: How many messages you’ve published through Socialflow on all or a selection of your social platforms, broken down by day. The percentage next to this number indicates whether or not you’ve published more or less than the previous time frame.
Clicks (Previous clicks v. current clicks): This total sum and graph indicate how many link clicks your content has received in the given time frame. The percentage shows how that total compares to the previous time frame, as does the graph. The lighter shaded bars represent that day, last time compared to the darker shaded bar representing that day, this time frame.
Interactions: This data includes all engagements outside of the click: Likes, Shares, comments, reactions, Retweets and mentions, etc. so you can get a general sense of how much engagement has increased or decreased. It does not include LinkedIn or Pinterest since these networks do not provide them in the same way from their API.
Total Audience: Total number of fans or followers.
Audience Gains: How many new fans or followers you have gained in that time frame.
Audience Engagement: Audience engagement broken down hourly to show you what times of day received the most engagement. It's displayed in a seven day period but will be averaged for longer time frames.
Reports: Messages Page
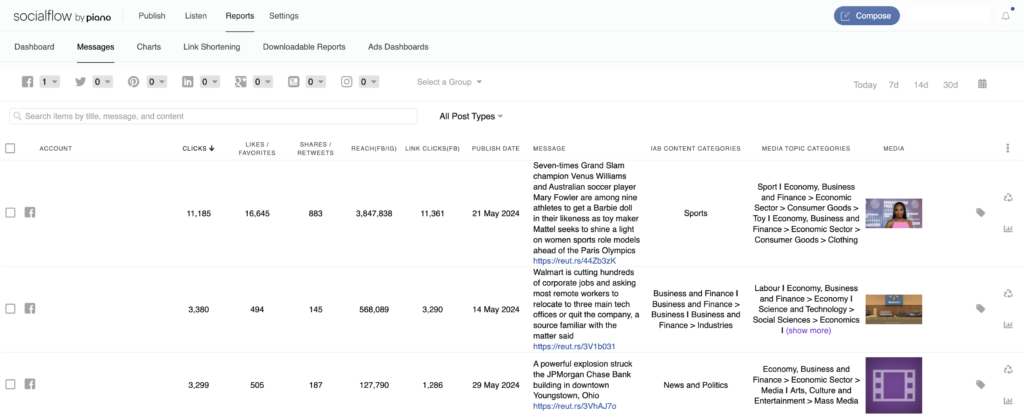
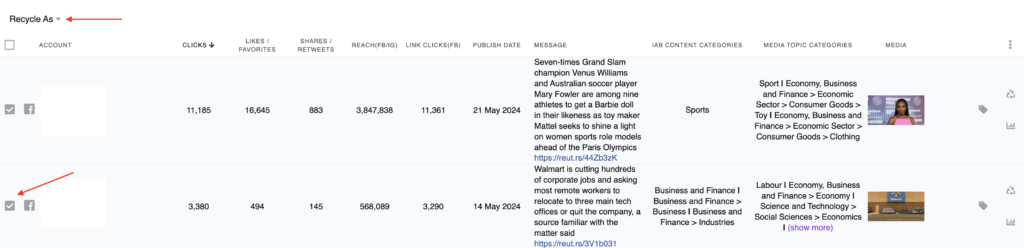
This page provides an easy way to find top-performing content. You can click the column headers for the metrics you want to sort by, making it easy to see which posts performed the best in terms of clicks, Likes, Shares, or any other metric.
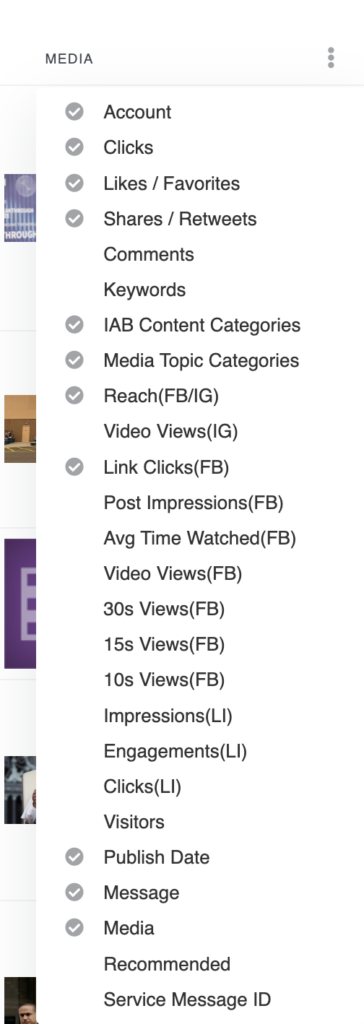
You can find more metrics to filter by if you click the 3 dot icon on the right, just above the first post in this list.
Pro Tip: Once you filter your messages to view top-performing content, you can then bulk recycle using the checkbox feature. You can even recycle content that wasn’t sent through Socialflow originally.
Searching Content
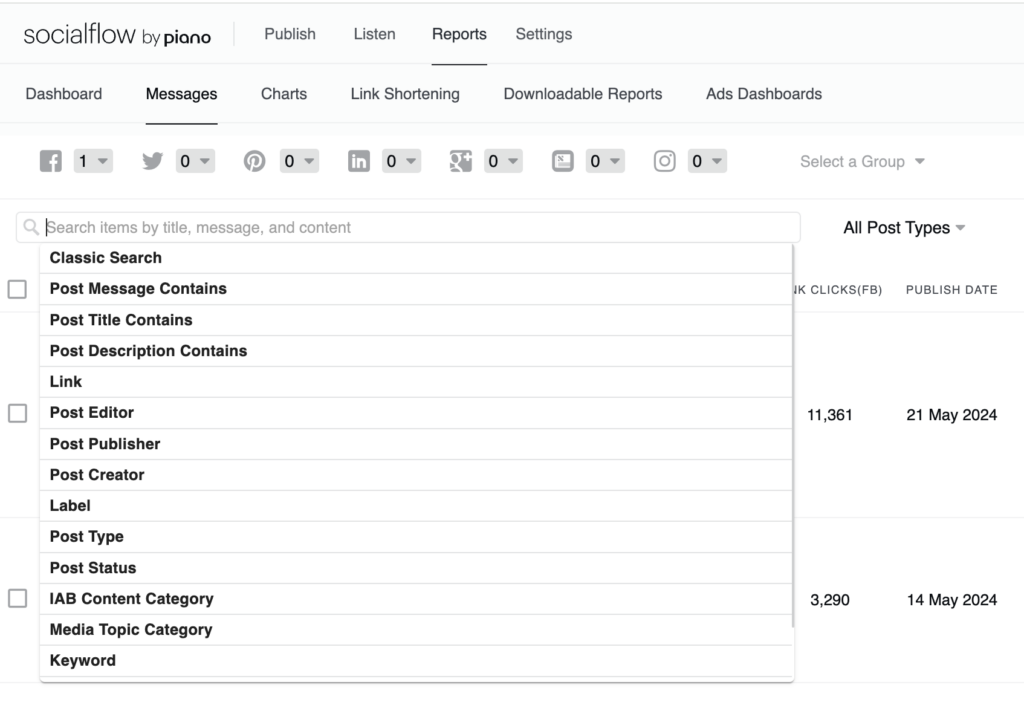
Using the search bar at the top, you can access search options like Classic Search (or the default search) as well as enhanced search options like Post Editor, Link, or Label. As you type in the search box, suggested search options will show up automatically. Click on the option you’re interested in to start the search. The search criteria you enter will show up in a small outline or “chiclet” within the search box, and the search results will be displayed on the page.
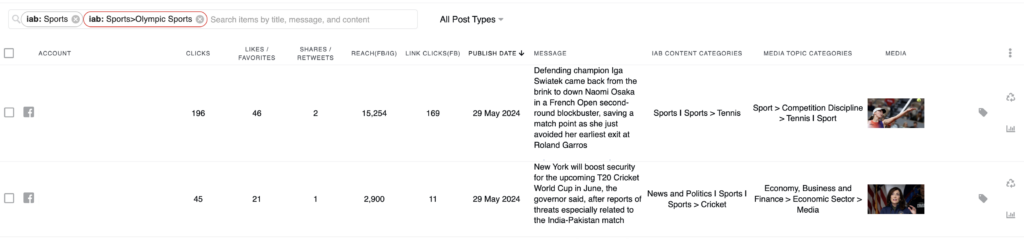
Sometimes you want to eliminate certain types of content from appearing in the list of messages.
One option is to type “not” before your search and the search results presented will be updated to not include those items.
Another option is to hold the shift button and click on the chiclet that contains the original search. The circle or outline around the search chiclet will then turn red indicating that the search is for posts that are NOT in that specified category. For more information on how to search, watch our original video tutorial.
Here's an example where we searched for sports content NOT Olympics.
Reports: Charts
Here you can generate graphs representing total clicks, likes, shares, retweets, comments, mentions, followers, or page likes, for one or multiple accounts - as either a sum or a comparison.
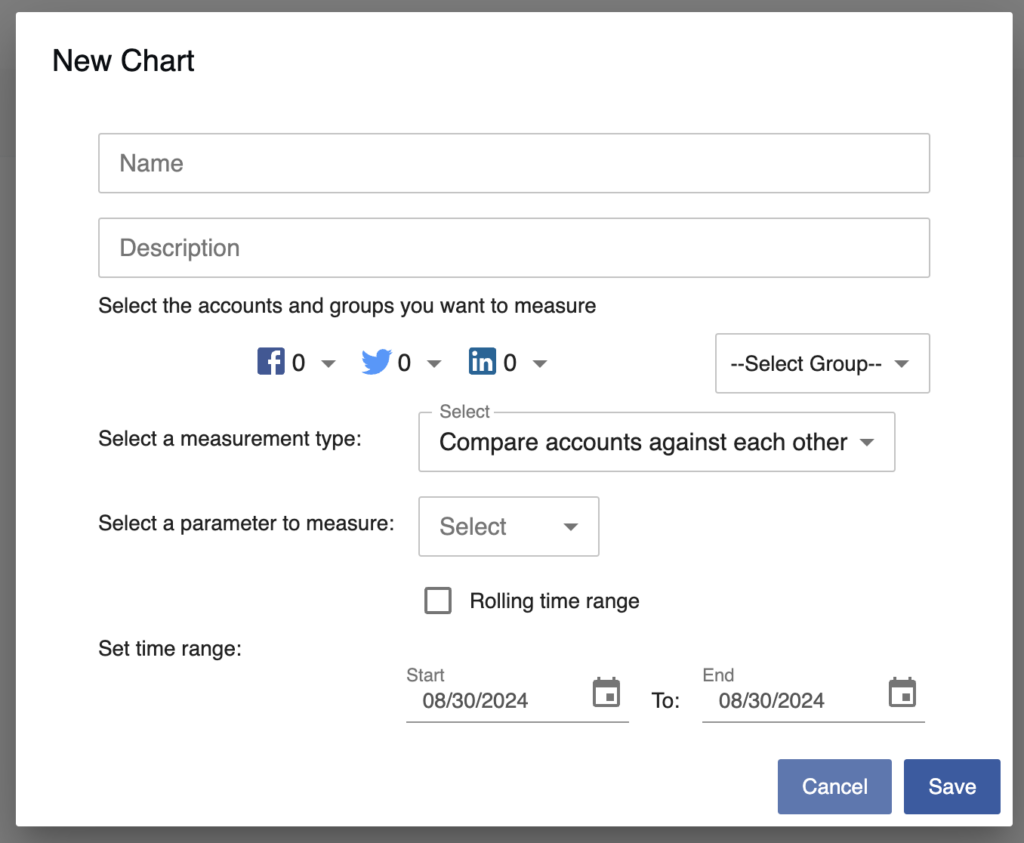
You can set a specific time frame or create a graph that updates on a rolling time frame, for example, every 7 days. The charts you create can be downloaded as a .png file.
Reports: Link Shortening
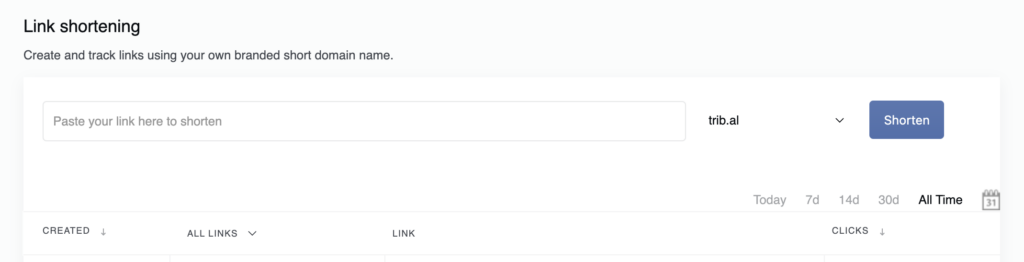
This Link Shortening page allows you to enter a long URL and have it shortened by our platform. Then you can use that new short link outside of Socialflow (ex. email, marketing campaign, etc) and this page will display the click count since our system shortened the link. If you have a custom branded short link installed, you can use that here when creating new links as well.
Reports: Downloadable Reports Page
Here you can generate and download Excel files of your social account data for closer analysis. First, click on the Create Report button on the right.
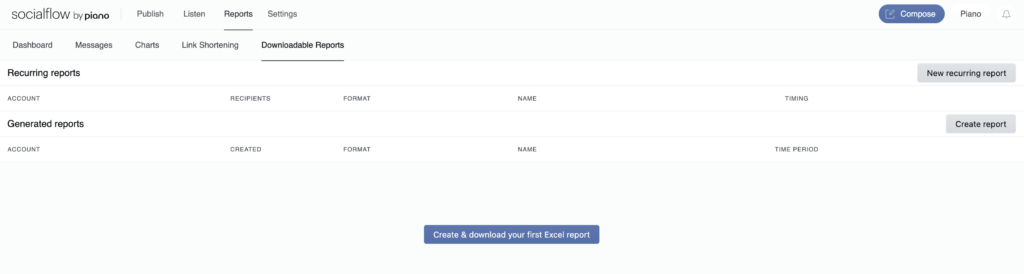
Once you click Create Report, you'll see there are a few different report types to choose from:
-
Message Report
-
-
This report will list all messages for the account and time frame that you’d like to review. It includes all the engagement metrics for the messages as well as the user who created the message and the label on that message.
-
-
Label Report
-
-
After you've labeled content during the publishing process, you can select the label here and only see those messages and their engagement data. You can select multiple labels to make comparisons of different types of content to see which performs better.
-
-
Month Over Month
-
-
This report shows your total engagement data per month for your individual accounts for whatever time frame you select. It includes the percentage of change for each of the stats you can quickly get a high level view of how the account has progressed.
-
-
Week Over Week
-
-
Similar to the month over month report, this report shows your total engagement data per week and also includes the percentage of change.
-
-
Day Over Day
-
-
Same as above but to be used for daily comparisons.
-
Once you select the type of report, you can choose which social account and for what time frame you need data for in the pop-up window:
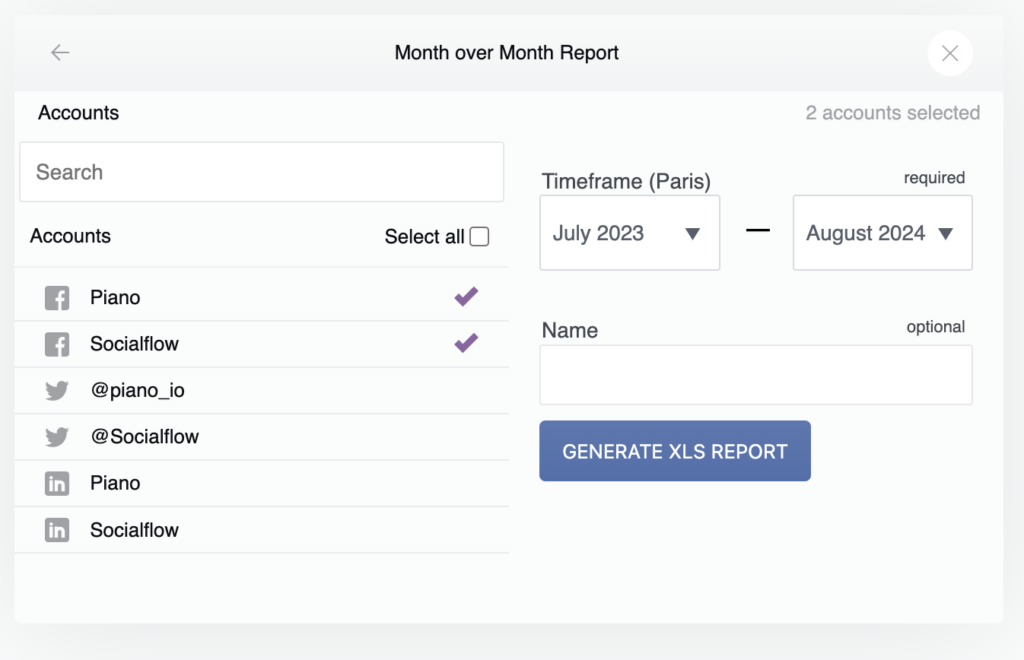
The report will generate and create a new line item in the reports list. Just click the download button to open the Excel spreadsheet.
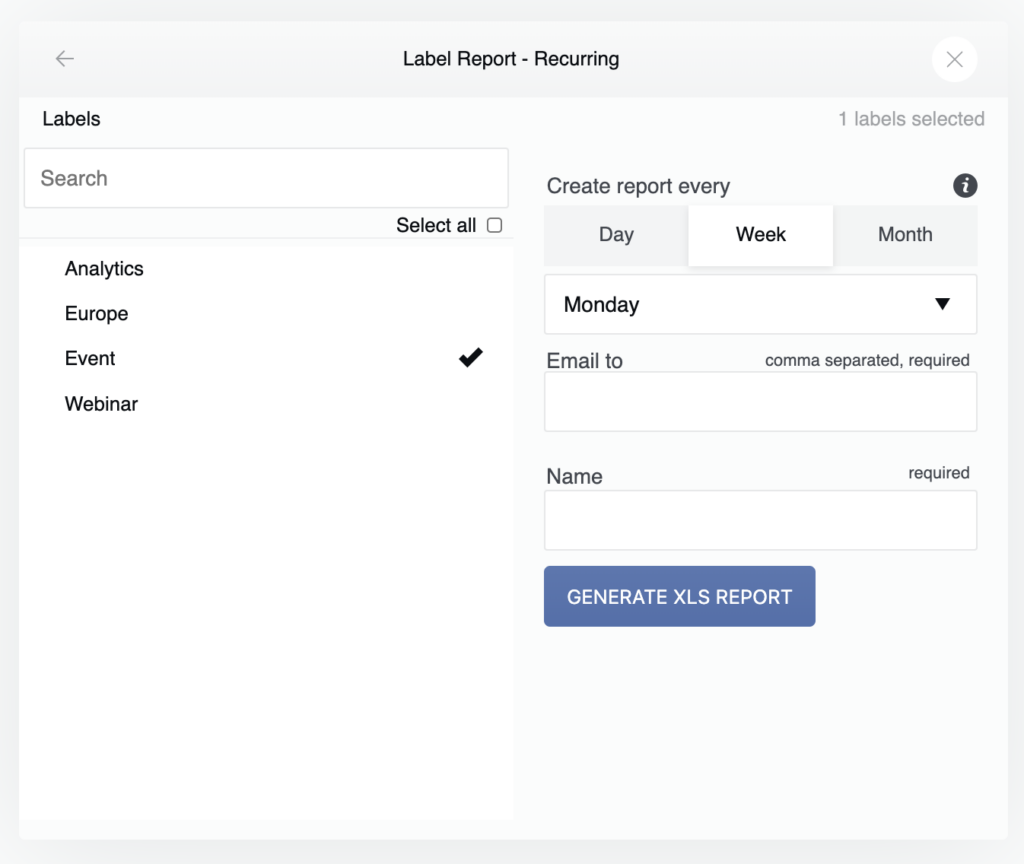
All of these reports are also available on a recurring basis. Just click New Recurring Report and select one of the same report options outlined above. Then you'll have the option to select the regularity (daily, weekly, monthly) and to which email address or enter multiple, comma separated emails.