Measuring Lightweight template rendering time
When a user arrives on a page, the Piano platform performs multiple actions to determine the next best action for that user. The Piano script executes, and Composer executes all relevant experiences and selects appropriate actions. In some cases, Composer connects to other systems, such as Piano Management + Billing to fetch offers and terms. Finally, an offer template is rendered. All of these actions together make up the total time to template display.
This chapter on telemetry is about measuring render time. While Lightweight templates were created to shorten the time it takes to render the offer template on the site, the following method works for both Classic templates and Lightweight templates.
Adjusting the URL for measurement
To start tracking telemetry and measuring the template performance please add query parameter pn_telemetry=true to url of a page where we need to have a Lightweight template.
So instead of the URL: https://website.com/article123/
use the URL: https:/website.com/article123/?pn_telemetry=true
Add the query parameter to the URL and reload the page. It works in standard as well as incognito browsers.
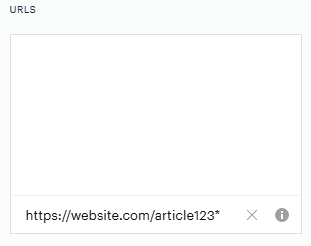
If after the reload you don’t see anything from the data described below, check your Segment pages card if you don’t use absolute article URLs in the URL targeting. If yes, add an asterisk (*) behind it. If necessary look for more info on URL targeting. This should be a rare case, possibly in Sandbox, the vast majority of URL-based targeting is relative and is using asterisks anyway.
URL example with an asterisk:
Available measurement types
All time periods below are shown in milliseconds.
There are a couple of different ways to get telemetry info. After you add the parameter to the URL and reload the page, you can do the following:
1. You will see a black square in the top right corner of the page.

Here it is important to understand what exactly these measured times mean:
Piano SDK init time: the time between when the user opens a page and when the Piano script initiates. To decrease this time, here are a couple of hints. We often see numbers around 1–2s; it can be made faster. Decreasing this time is mostly in your hands.
Experience execute: the time between when the user opens a page and when Piano Composer runs through all experiences and executes the correct one(s). In this case, Composer did it in 571ms – 429ms = 142ms. This number depends on the number of experiences and their complexity. In general, it should be around 100–150ms or less.
PianoWidgetRenderTime: the time between when Piano Composer has everything necessary to render the template and when the template is rendered. In this case, 46ms. Classic templates are slower, around 300–600ms, sometimes more, depending on the template complexity. Lightweight templates shorten this time — the fastest we've seen was ~35ms+; more frequent results are around 70–100ms.
2. You can also call the render time from the developer console by writing the command pn.pianoWidgets.getTelemetry(). renderTime is the time period from the start to the end of rendering a template.

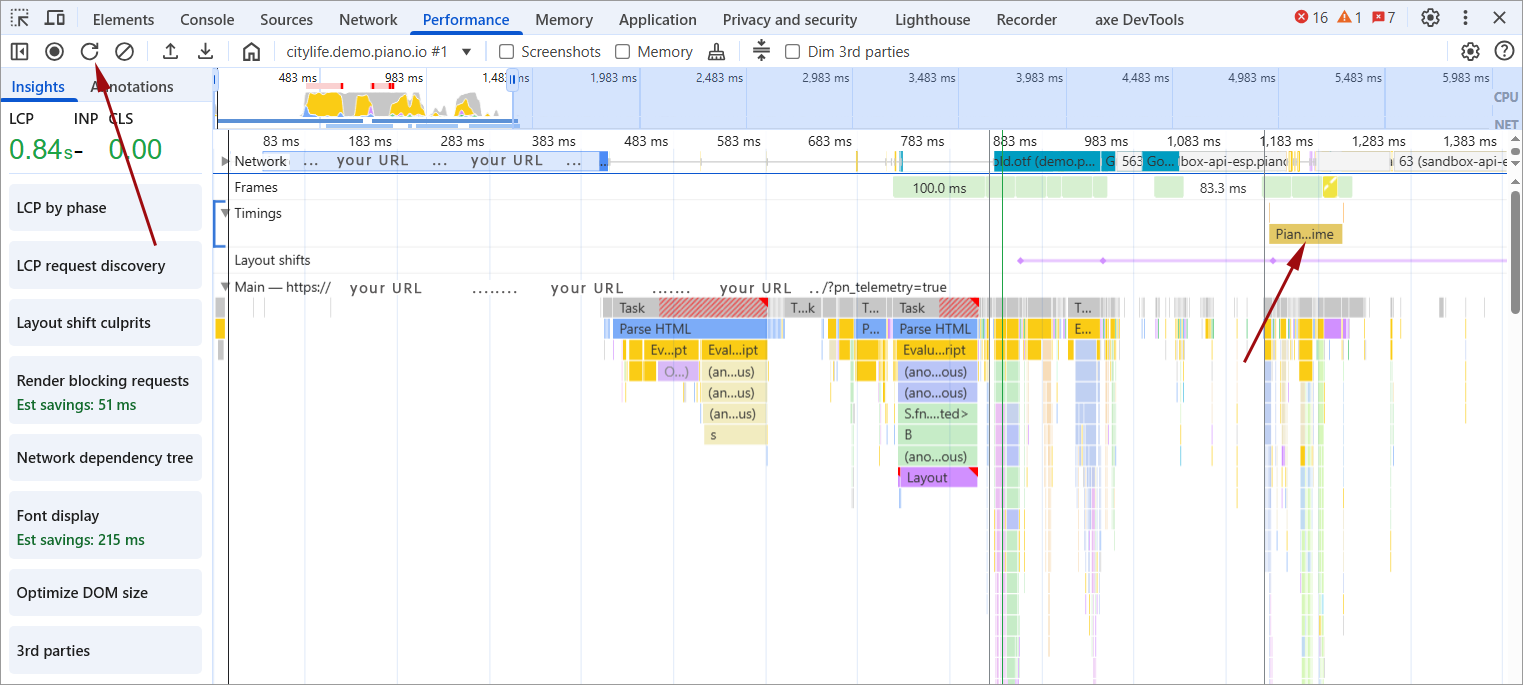
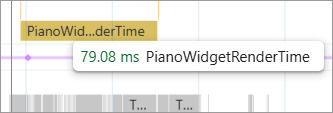
3. In Chrome DevTools, look for PianoWidgetRenderTime within the Timings track of the Performance panel. Hover with the cursor over it; it shows the load time of the Lightweight template (widget) in milliseconds.
If you don't see the timeline at all, click the reload button (top part below "Elements") to reload the site.
This is the method that tells you the exact template render time of any Piano template, both Classic and Lightweight offer templates set up in showOffer / showTemplate cards in Piano Composer.