
Viewing reports
Piano Management + Billing provides you access to reports that present data visually and to reports that provide raw data as table or csv file. To access these reports, click on Reports at the top right of your dashboard menu. The resulting dropdown menu has several options that allow you to locate exactly the information you are looking for. These options are described below.
Visual analytics reports
The reports grouped under the "visual analytics" section of the reports dropdown present the data you are seeking in a visual format, rather than raw data in the form of a table. Visual analytics are excellent tools for quickly understanding trends and performance.
Filters for all visual analytics
You may apply these filters to any visual report, allowing you to more effectively find the data you are looking for.
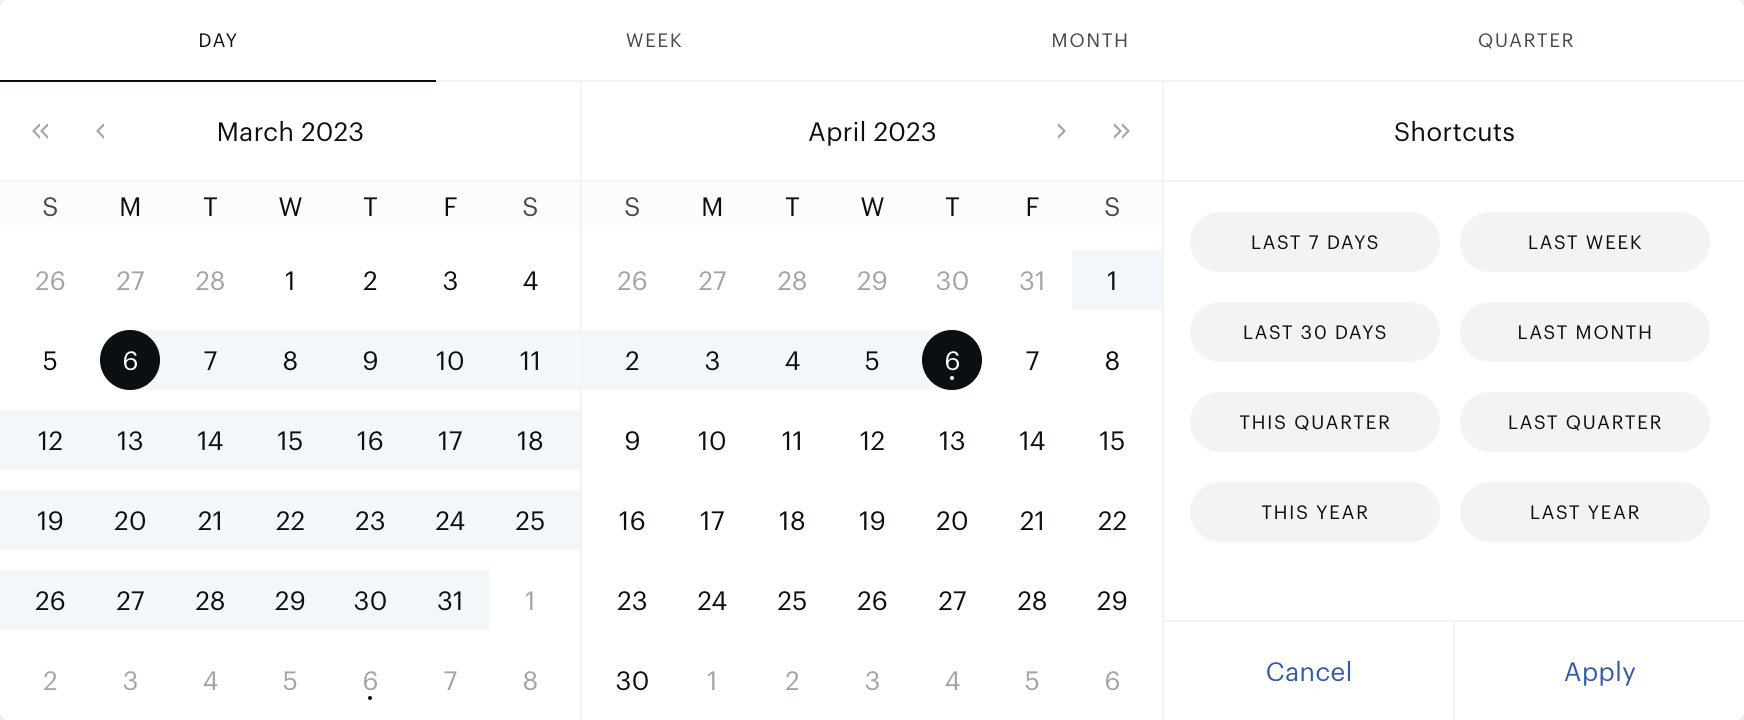
Time window: You can adjust the time period to view data from any time, not only the most recent time period. To do so, click on the date selector at the top right of the window, which will bring up two side-by-side calendar modals. In the left modal, select the start date for the period that you would like to view reports on, and on the right, select the end date. When you are satisfied with your window, click Apply dates at the bottom of the modal.
Time interval: Depending on the length of your time window, it may make sense for you to view the data segmented into different intervals. To do this, click on the date selector at the top right of the window. You will see options above the calendar modals that allow you to specify the interval between data segmentation. You may choose: Day, Week, Month or Quarter. For example, if you were observing company performance from 2020 to 2022, it may make the most sense to view the data by quarter to avoid cluttering the graph. However, if you were only looking at a report for the past two weeks, you might want to select daily to observe performance more finely.
Currency: You may further filter by type of currency by choosing which merchant account you would like to display. To do this, click on the Merchant account or All currencies selector just to the left of the date selector. Then select the currency that's best for the data that you need. (This selector is not available for the "Email reporting")
Groups and Terms: Finally, you can filter by various groups, including contributions from external terms or conversions on a specific term or offer by clicking the drop-down menu labeled All terms by type or All terms.
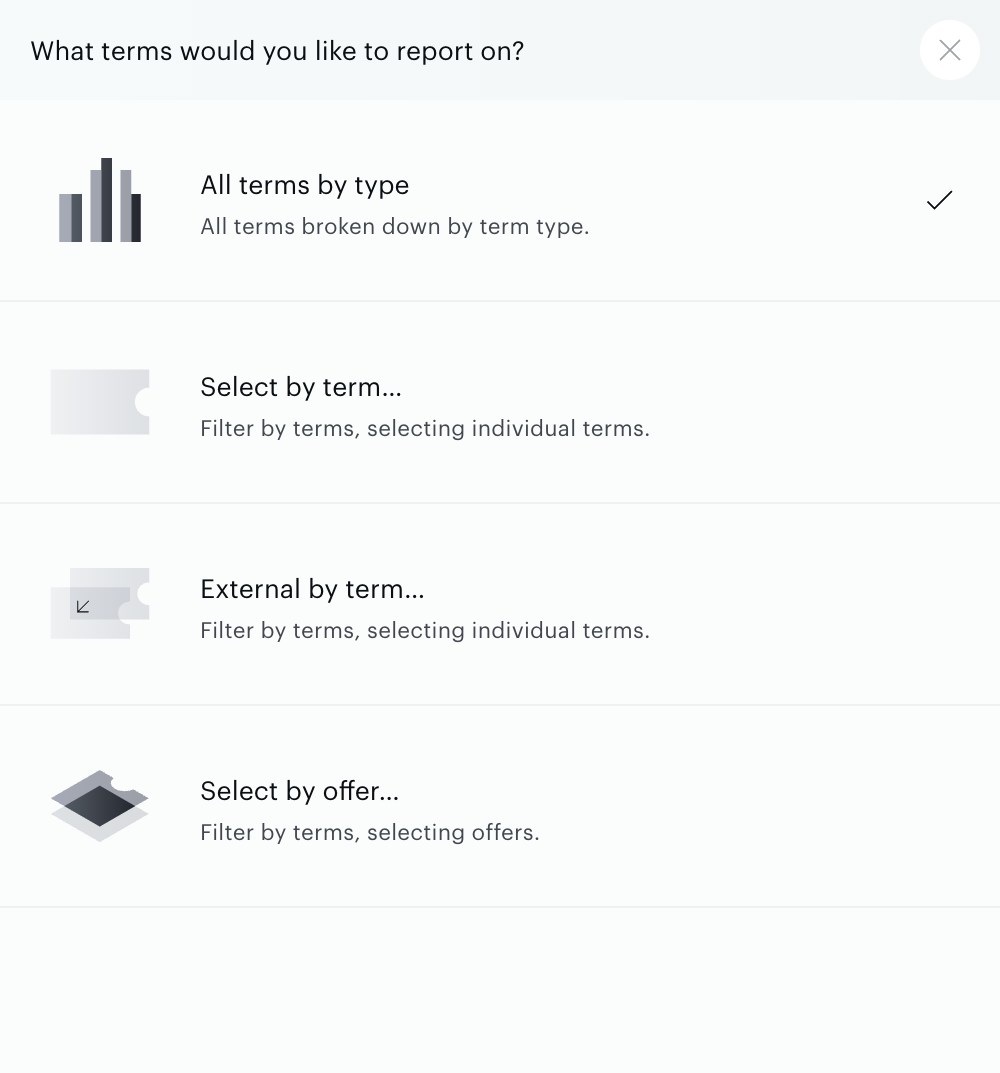
For the Visual Subscriptions report, you can apply the term filters in the table below the visual report.
To get a more quantitative view of the data, you may hover your mouse over any element displayed in the chart, and it will provide you with information about the nominal value from that time period and percent growth from the preceding time period. You may also scroll down to view a table of the data presented in the chart, which will include information on various metrics, such as the quantity, category, and revenue of the displayed information.
New activity
The new activity report presents a chart that tracks the number of sales per given period, as shown below.
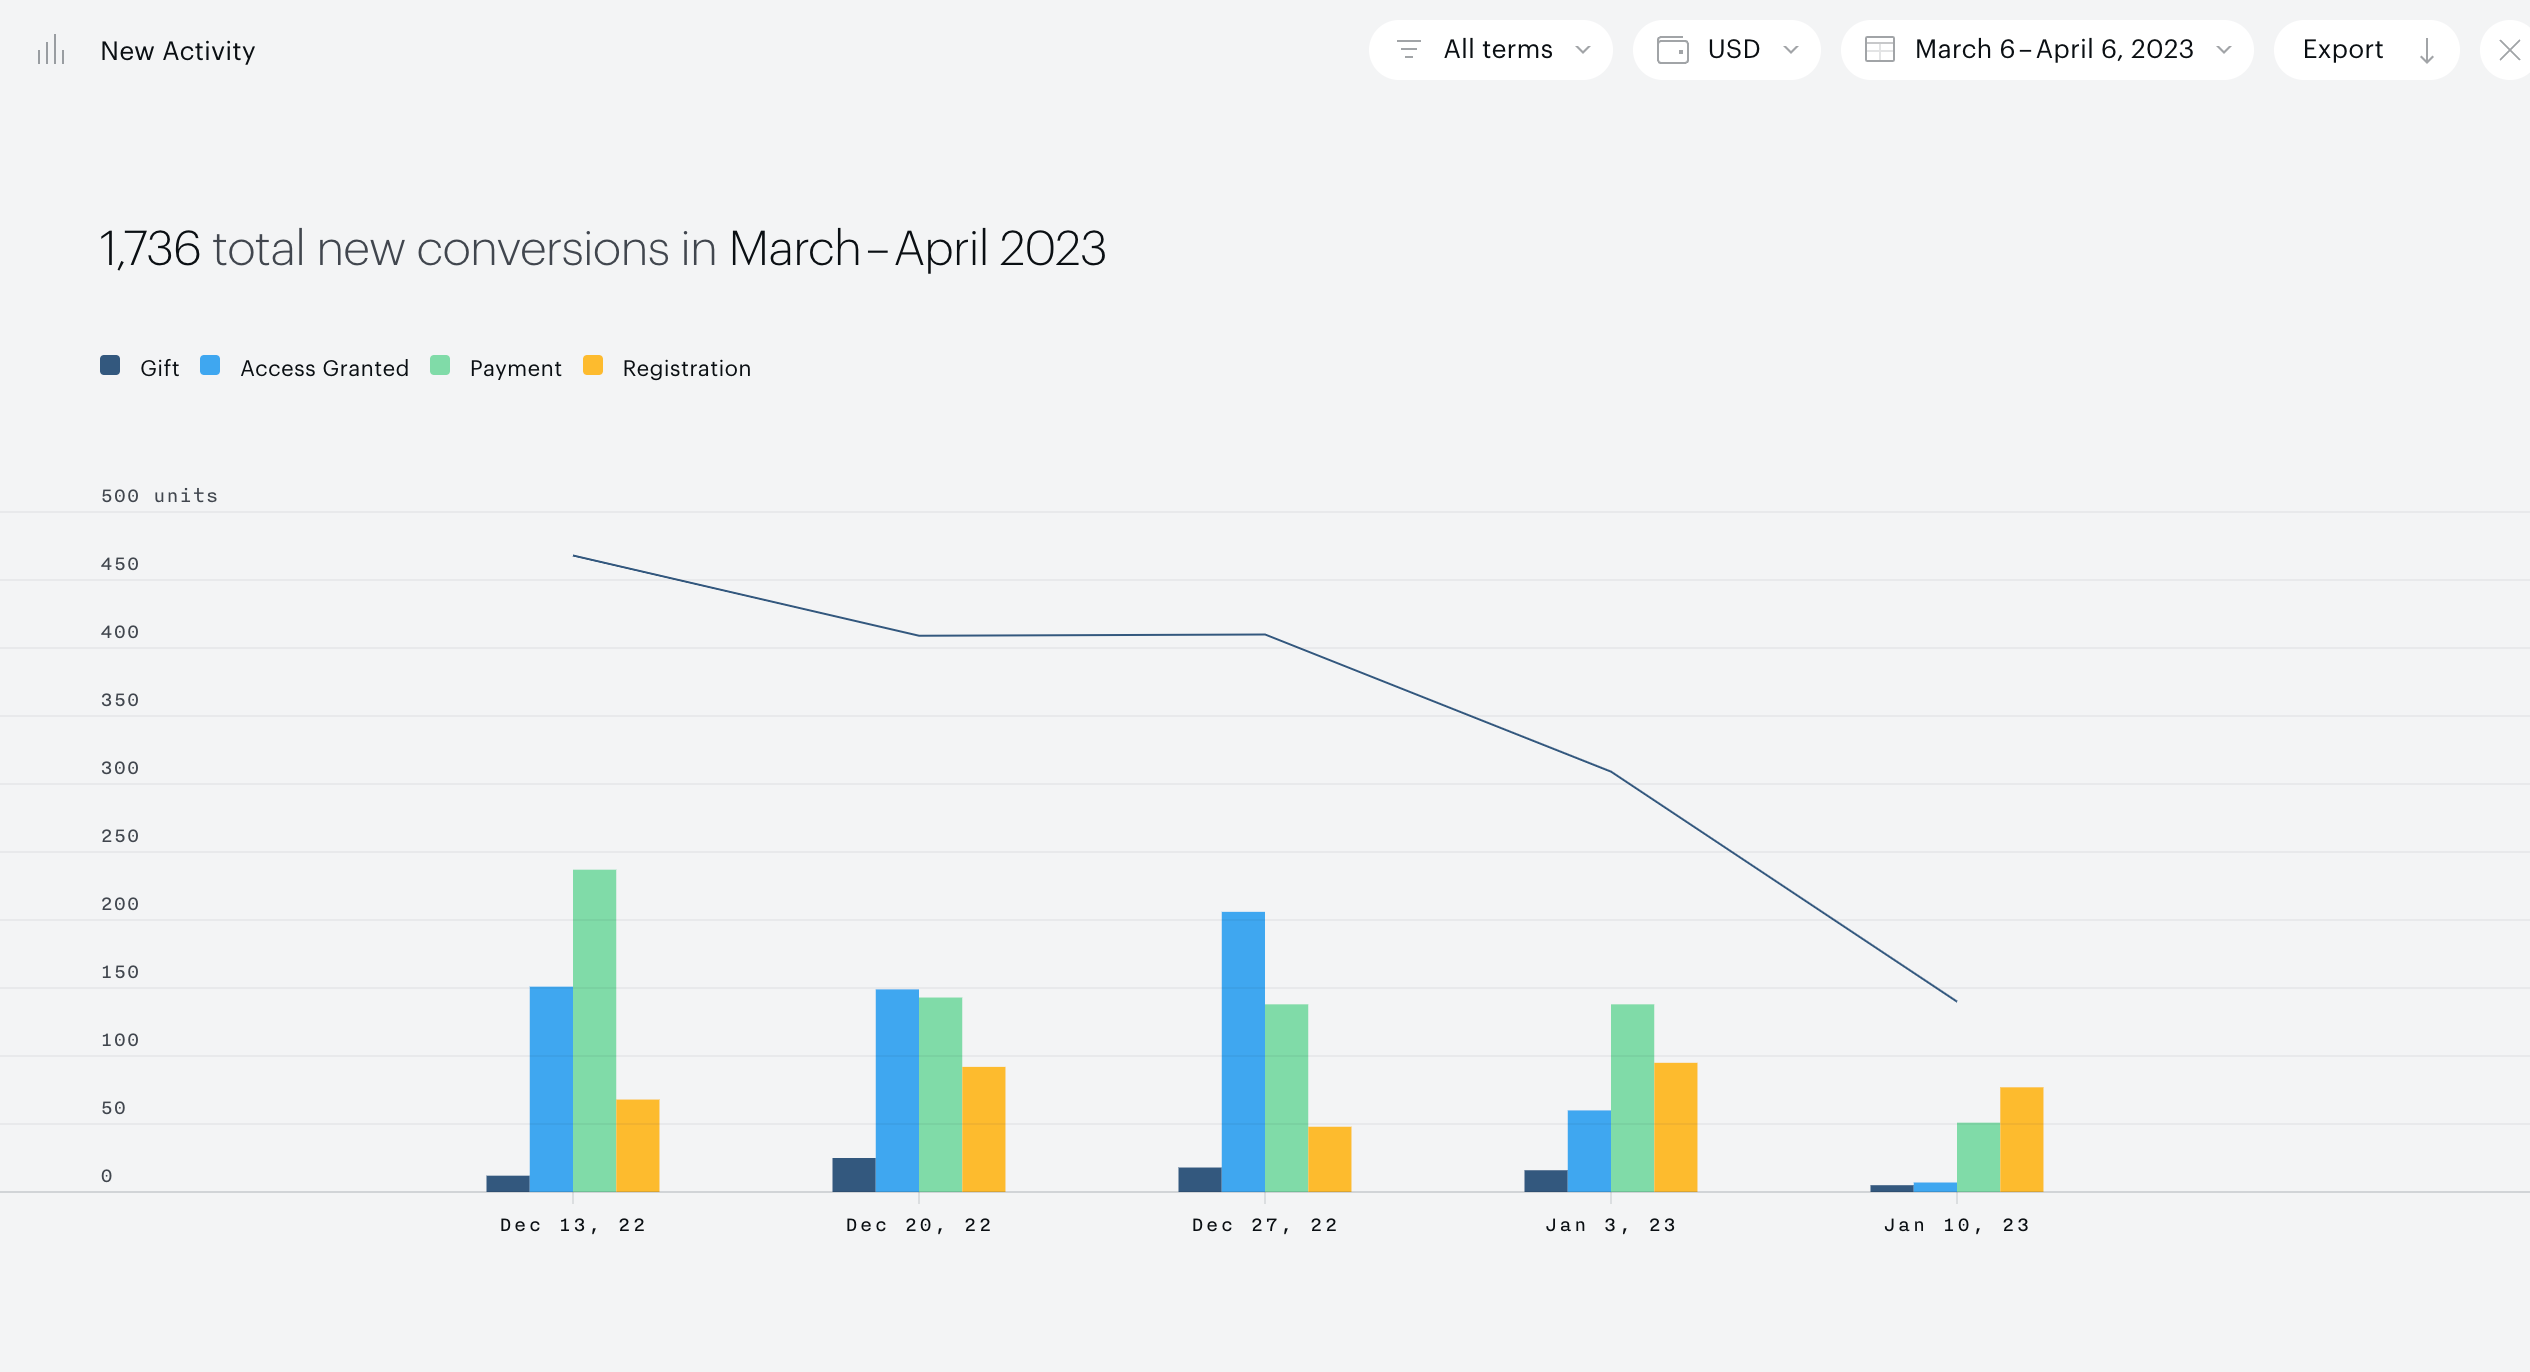
The new activity chart will only provide data on quantity when hovering your mouse over an element in the graph. To view information on the sales, scroll below the graph where information on the revenue gained and the total conversions for the various conversion categories are provided.

If needed, a detailed New Activity report can be downloaded as a CSV file in the top right corner of the screen via the "Export" download button.
Revenue
The revenue report provides a chart that tracks revenue earned over a given period, as shown below.
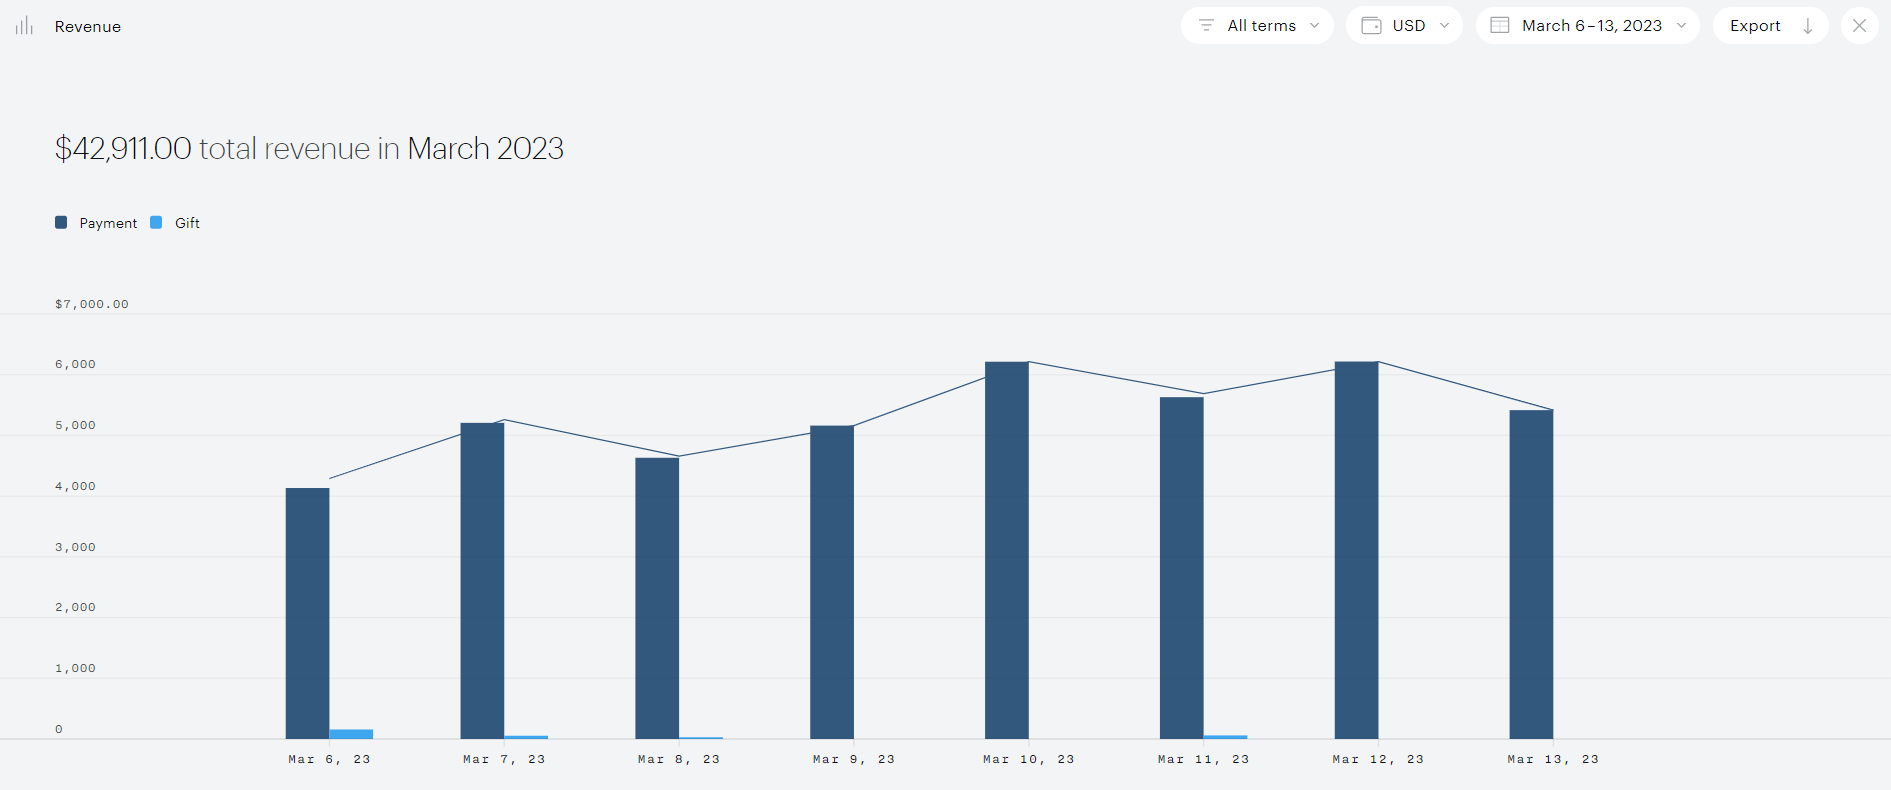
The Revenue chart will display only data on revenue when hovering your mouse over an element. To view more information on the number of transactions, scroll below the graph. A detailed Revenue report can be obtained by downloading the report as a CSV file by clicking the "Export" button on the top right corner of the screen.
As per the current logic, free trial subscriptions (where payment methods have been verified via a verification charge) are included in this report. Please note, that we don’t include free trial transactions with a verified state in the Transaction log report.
Refunded payments are ignored in the calculation of this report.
The default currency in which the report is displayed in is USD (if available). There is no option to change the default currency, but you can select the desired currency via the drop-down menu.
It's important to understand that the Subscription Management + Billing revenue report can be sometimes out of sync with the real data (and can't be adjusted) because of changes happening outside of the Piano suite (i.e. refunds made directly from the payment provider's dashboard, disputes, chargebacks, etc.).
Revenue data from external conversions, that occur via Google and Apple App stores, is not shown in the report.
Subscription visual report
The Subscription visual report provides data on subscription activity across your terms, throughout a period of time. Various filters can be applied to the data so you can quickly find the key insight you are searching for or investigate term performance on a deeper level. Read the full Subscription Management + Billing Subscription report documentation for more details on the functionality.
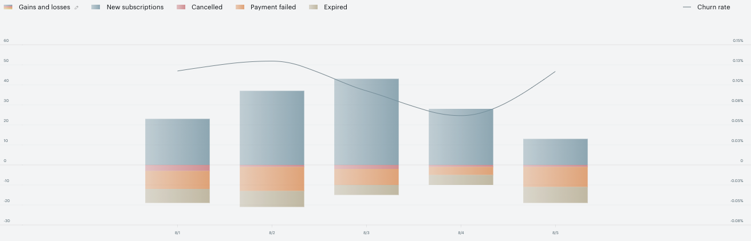
While the Subscription visual report and its exports show subscriptions throughout a window of time, see the Subscription log report for more robust data on the state of all your site’s subscriptions at this exact moment.
Email reporting
Email reporting provides a pie chart that displays the number and percentage of emails opened, unopened, and bounced in your specified time window.
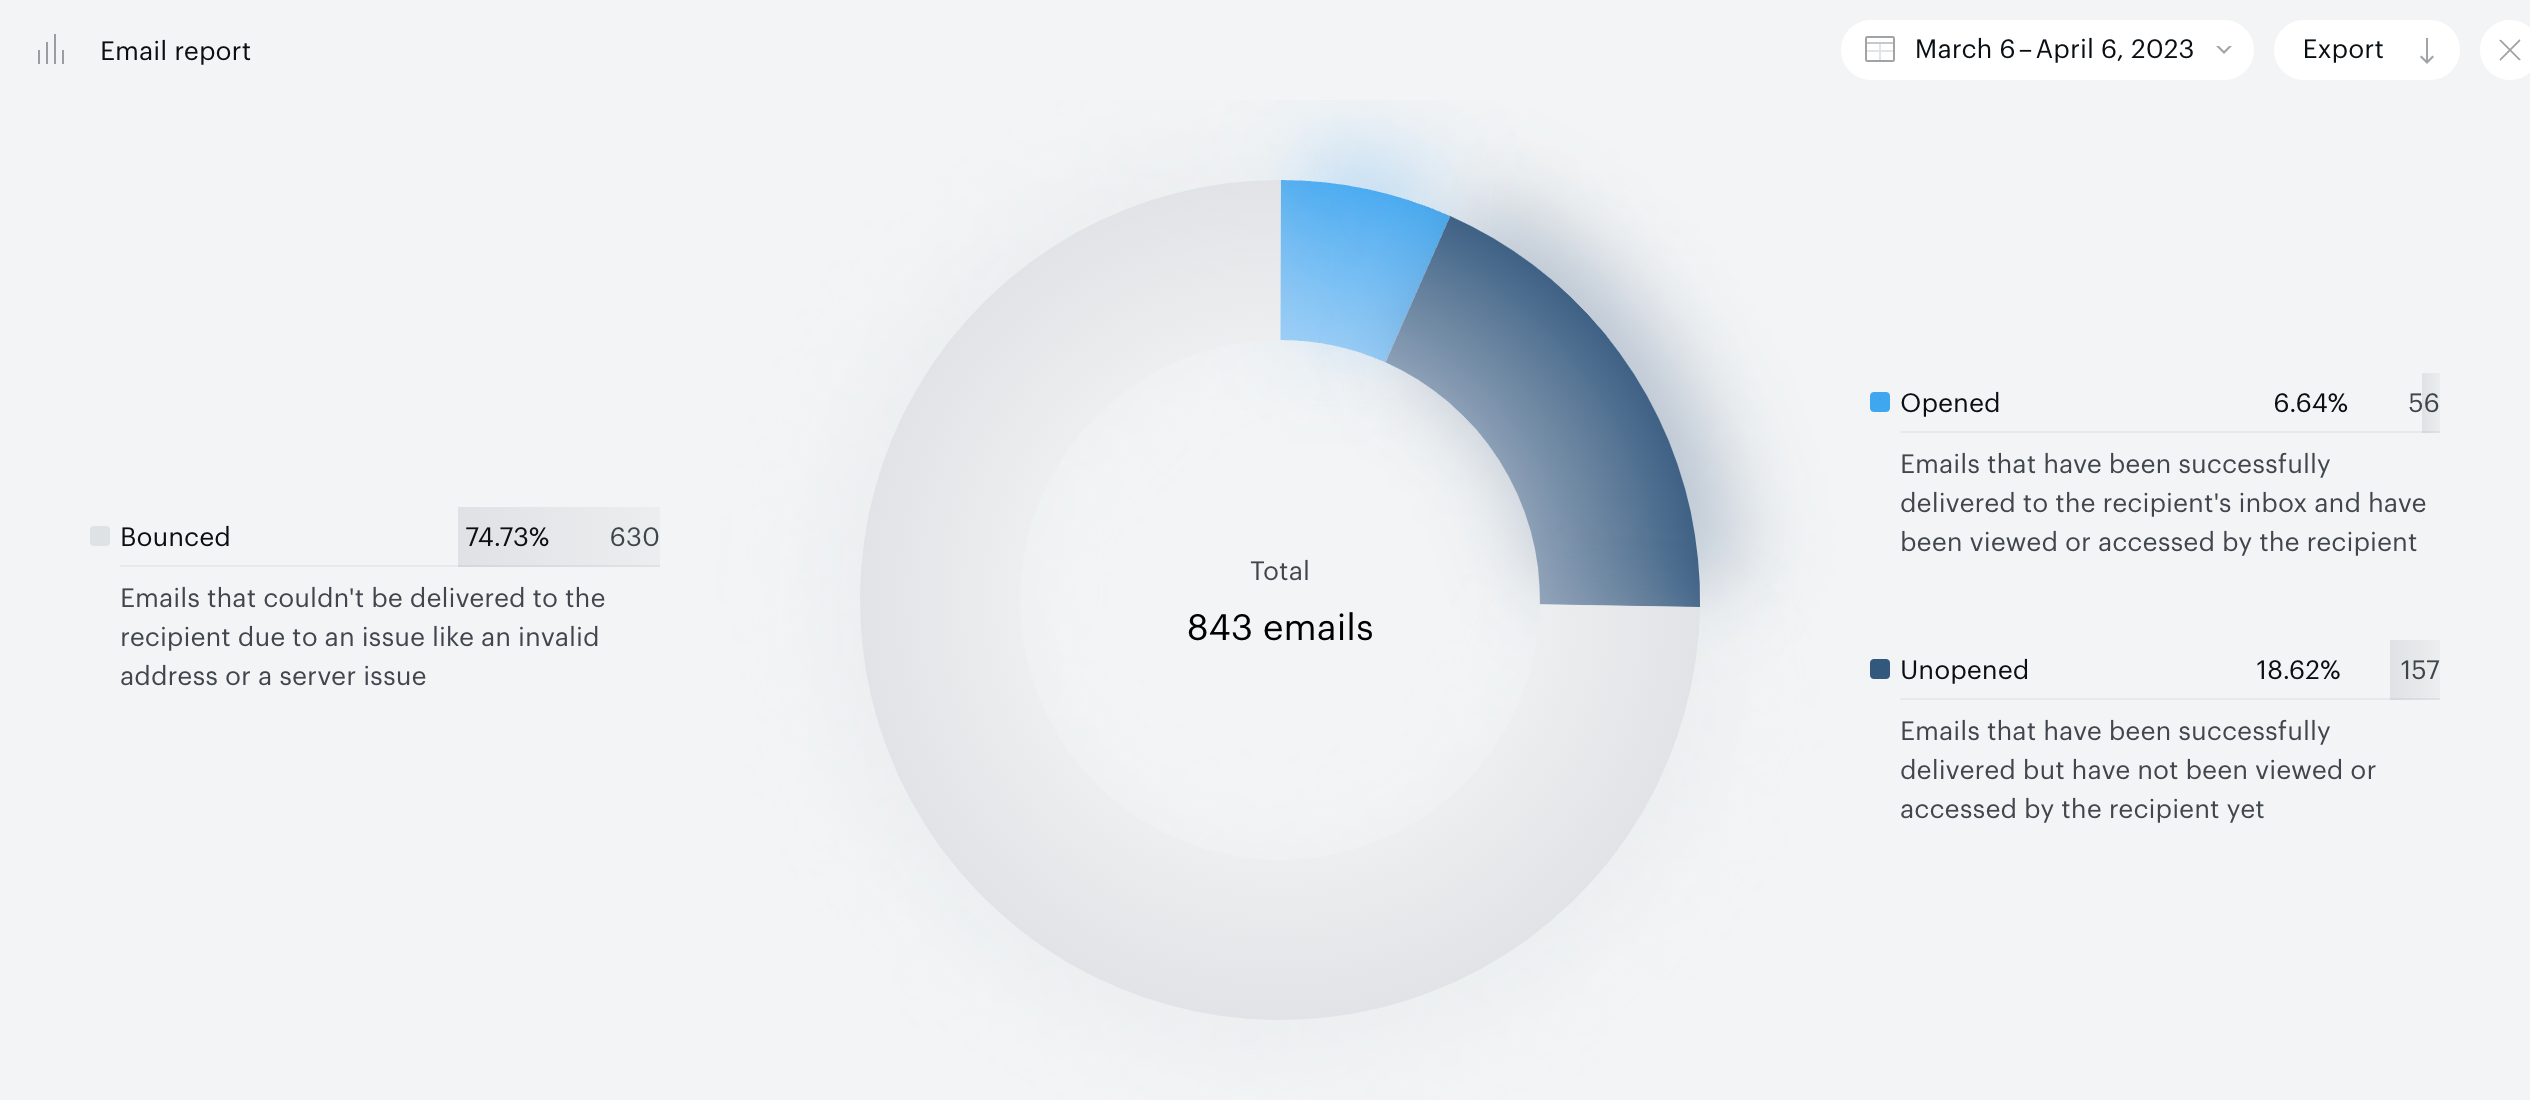
To view more detailed information on outgoing emails, scroll below the chart, where you will find data presented by email type, with quantitative information about the number of sent emails, number of delivered emails, bounce rate, number of emails opened, and open rate for each category.
This data can also be viewed as a CSV file by downloading the report via the top-right Export button.
Conversion
The conversion report gives you information on how effectively you are targeting your user base, and it is perhaps the most useful report Piano offers for driving revenue and promoting sales. In contrast to the Composer conversion report, the Subscription Management + Billing conversion report provides data on your entire Piano application, rather than a single experience, giving you a holistic view of the performance of your site.
The displayed chart provides data on the number of impressions (presented offers) that your users have received, the number of users who converted on those offers, and the conversion rate. This is particularly useful if, for example, you want to gauge the effectiveness of a marketing campaign that you launched on your site in May. You could go to the Conversions report and observe the conversion rate or traffic change due to this new campaign. These data are enumerated by hovering your mouse over an element of interest.
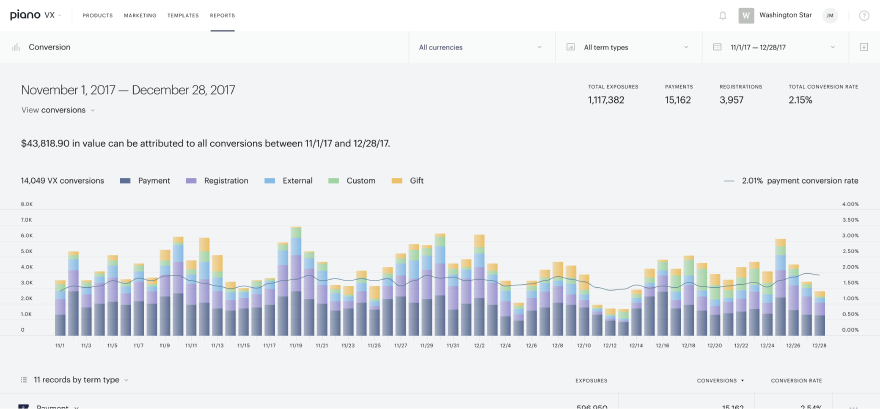
Additional information about the report can be found at the dedicated documentation page here.
Total performance of terms in all offers: Here, you can see the total performance of each of your available offers by number and percentage of conversions. This percentage is the amount that the specific term contributes to the total number of conversions; it is not the conversion rate.
Templates: In the Templates table, there is information on each of the templates you present to users, with data on the number and rate of conversions on each template. To prevent cluttering the page, 10 of your templates are presented in the table, with the rest accessible by clicking the arrows at the top right of the table.
% Promotions: In this table, you can observe the effectiveness that your promotions have on conversions. The number of conversions and the percent of total conversions that each promotion is responsible for is provided here.
Devices: The devices table indicates the number and conversion rate that occurs due to users on different devices (desktop, mobile, tablet, game console, digital media receiver, or wearable).
Pages: Under pages, you can observe which of your pages are drawing the most conversions and highest conversion rates. This is particularly useful if you have composed different experiences for your various pages and you would like to know which experience makes users more keen to convert on your offer. This table only shows the top 50 pages with respect to conversions, and the associated conversion rate is only present if that page also fell within the top 50 pages with respect to impressions. Therefore, you may have certain URLs that present N/A instead of a conversion rate, even when conversions are non-zero. In these cases, the number of impressions was not high enough to make it into the top 50.
The "Other entries" row includes all conversions and impressions that did not fall within their respective top 50 sets.
To enhance data privacy and manage the user interface effectively, there is a restriction on URL data displayed within the UI, limited to a 31-day timeframe. If you require data spanning a period exceeding 31 days, you need to utilize the data export to CSV functionality in the top right corner of the screen.
When you request URL data for a duration beyond the 31-day limit, a notification message will be displayed in the respective table, informing you of the restriction.

Geography: The Geography table gives you a picture of where your user base is most likely to convert on a term. You may view the number of conversions and the conversion rate in any country that a user has converted in.
Tags: Here, you can see how certain pages that you have marked with tags affect the conversion rate and behavior of your users.
Campaign codes: In Campaign codes, you can view metrics on any campaign codes that were in effect during the time window specified and receive data on how many users converted from the given campaign as well as the average time between seeing the campaign and converting.
Churn prevention
The Churn prevention report available for clients using the Passive churn prevention feature is thoroughly described here.
Generating report logs
The reports grouped under the "logs" section of the reports dropdown allow you the opportunity to view the raw data logs on all of your users, transactions, and subscriptions. Logs allow you to access the data firsthand and get a more detailed account of the financials of your company.
Transactions
Importatnt to understand that Subscription Management + Billing transaction reports can be sometimes out of sync with the real data (and can't be adjusted) because of events happening outside of the Piano suite (i.e. refunds made directly from the payment provider's dashboard, disputes, chargebacks etc.)
Transaction log report
In the Transaction Log report, you can view a table of all transactions made by your users within a selected time period. The report can be filtered by date and various other fields, such as transaction type, term, payment method, currency, price, and transaction status. Use the date picker or filter icon to define your own criteria and adjust the view to display data from any desired period.
For more information about the transaction log report, please visit this link.
Transaction log .csv
You may also choose to download a .csv of the presented data. The provided .csv will include the user email, information on the transaction such as term, ID, and status, and start and end dates of the user's access. For a full list of the information available in the transaction log csv, click here.
To generate this .csv, start by clicking the Export button at the top right of your window:

When you click this button, you will be asked to create a name for your .csv. You can choose any name you would like that helps you identify the information that is contained within that .csv. Once you are satisfied with a name, click Submit, which will create the .csv within Piano's system. To download that .csv, go to your "Download Center" by clicking Reports→Download Center. You can then click Download on any previously generated file. If you do not see the .csv you just created, refresh the page in a few moments to allow sufficient time for generating the report.
Latest revenue recognition transaction list .csv
You may also download the latest revenue recognition transaction list, which includes information on the external transaction ID, user email, details on the transaction such as term name, duration of access, and status, and a month-by-month enumeration of revenue recognition. For details on the figures in this report, you can read more here.
Revenue recognition reports are not impacted by dates selection and the downloaded list will always regard the last full month starting from the third day. For example, on March 4, you would get a report for February (February 3 to March 3); while on March 1 the report would cover January (January 3 to February 3).
To access revenue recognition reports for months before, use the Download center.
You can obtain the latest revenue recognition transaction list by clicking the Revenue Recognition button and selecting Transaction list from the drop-down menu. When you click this, you are not asked to create a name, as Piano does that for you; the requested report is downloaded directly from this page.
Latest revenue recognition summary .csv
You may download only a summary of the latest revenue recognition if you do not need such a detailed report. This report includes the monthly cash flow that is attributable to each of your payment terms for the entire history of your relationship with Piano. If you would like to know details about the entries in this report, you can read more here.
On the third of each month, the revenue recognition summary .csv will automatically compile in your Download center for the month prior. This report will display only lump sums of recognized revenue for that month.
You can create this summary by clicking the Revenue Recognition button at the top of the screen and selecting Summary from the drop-down menu. When you click this, you are not asked to create a name, as Piano does that for you; the requested report is downloaded directly from this page.
Revenue recognition reports are not impacted by dates selection, and the downloaded list will always regard the last full calendar month starting from the third day. For example, on March 5, you would get a list for February (February 3 to March 3), while on March 1 it would cover January (January 3 to February 3).
To access revenue recognition reports for months before, use Download Center.
Subscriptions
Subscription log report in UI
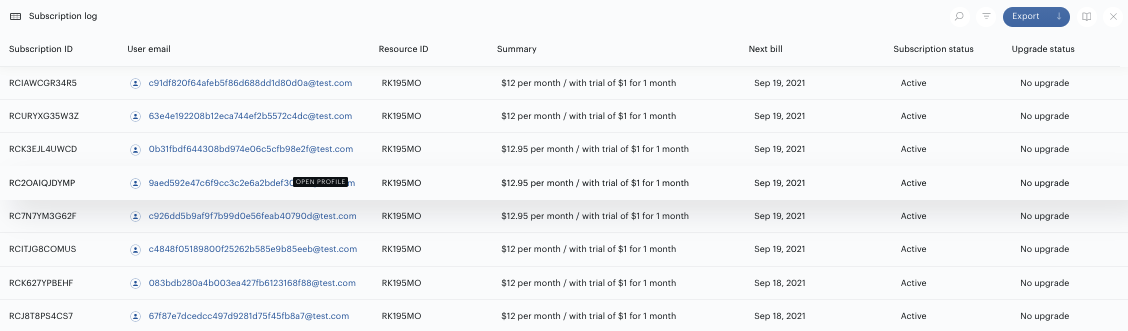
In the Subscription log report, you will see a list of all subscriptions ever created in Piano Management + Billing. The report is a snapshot of the state of the subscriptions as they are currently.
Clicking on a subscription in this list will bring up the user summary with an overlaid window that gives details on that particular subscription. Find more information here.
Subscription log .csv
The Subscription log report export is a .csv file with extensive data points about the subscriptions as they are upon the moment of download. Key metrics include:
-
Subscription status
-
Upgrade status
-
Trial status
-
Auto-renew
-
Auto-renew disablement date
-
Renewed
-
Created via upgrade
-
Next billing date
-
Last billing date
-
Logins last 30 days*
-
Pageviews last 30 days
-
Currently in grace period
-
Regular price
-
Trial price
-
Offer ID
-
Term ID
-
Resource ID
-
Promo code
-
And dozens more...
*This field is currently being populated only for clients using Identity Management. For other User management systems, this field won't contain any data.
To get a comprehensive list of the information provided in the Subscription log .csv, click here.
AAM
If AAM reporting has been enabled on your application and you've set up your Zones, you can generate AAM reports by going to Reports → AAM. From here, you can choose which type of report you would like to generate, the date range for that report as well as the report filename.
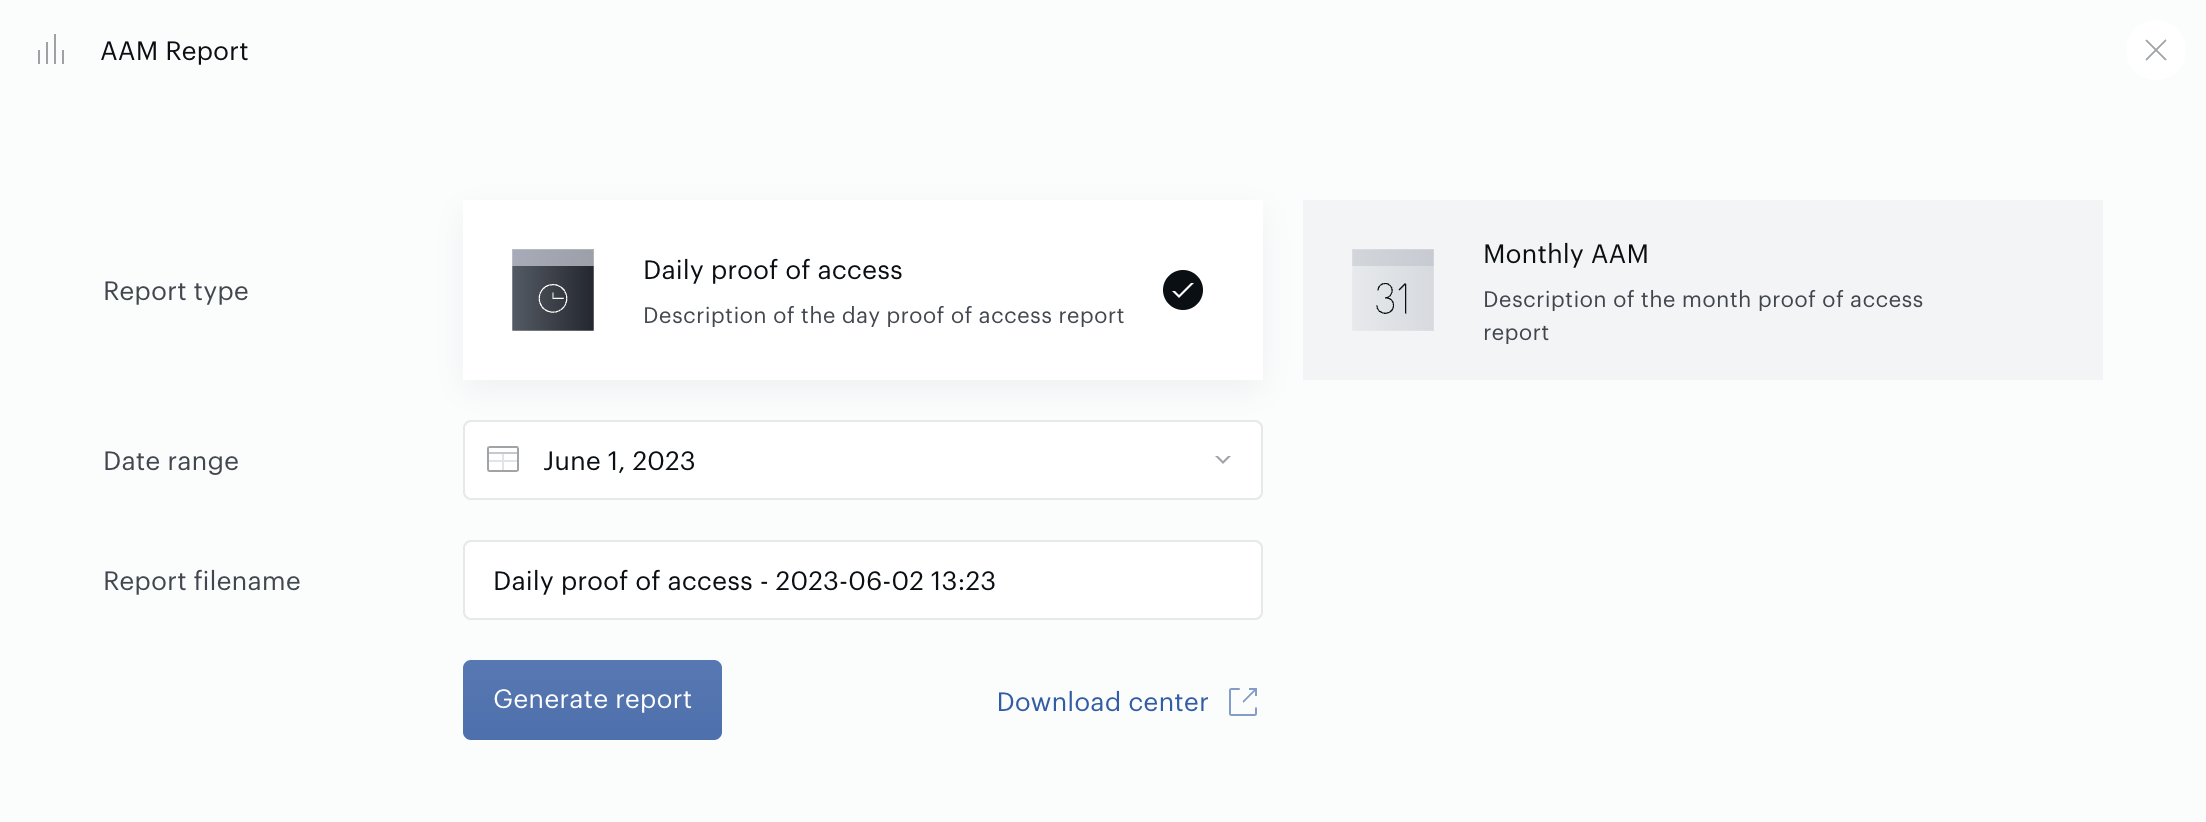
The daily proof of access report provides AAM data on every user within your AAM zones on each day in a given month, while the AAM monthly summary displays more general information about the number of users each day by term and zone. Once you have generated the report, you can follow the link to the Download center that appears next to the Generate report button, or you can follow Reports → Download Center to download the report in the form of a .csv. Details on the daily proof of access report fields can be found here, and details on the AAM monthly summary fields can be found here.
Activity reporting
Activity Reporting data logs allow you to create a report on either daily or monthly activity. The resulting report provides information on all of your terms and the status of each term and its activity during the specified time. This includes information such as number of active users, number of new users, month-to-date new users, and revenue gained. More detail on the fields within a daily activity report can be found here, and information on monthly activity reports can be found here.
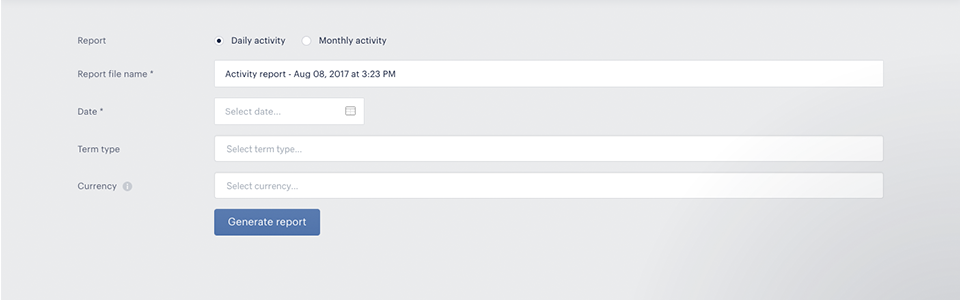
To generate an activity report, first specify whether you want it to be a Daily activity or Monthly activity by clicking the appropriate radio button. Give your file a descriptive name for your own identification purposes. Select a date or month that you would like to receive information on. Once you have chosen the date, you must click Apply selected date at the bottom of the calendar modal. You may choose to identify the term type and currency from the corresponding dropdown menus if you would like information only on a specific term or currency. Once you have specified the information you would like, click Generate report.
You may then view the generated report in the "Download Center," which you can access by clicking the text that appears next to the Generate report button that says Go to Download center. Alternatively, you can click on Reports→[bolder]Download Center. You can then click Download on any previously generated file. If you do not see the .csv you just created, refresh the page in a few moments to allow sufficient time for generating the report.
Access reporting
Access Reporting data logs allow you to obtain data on user access to specific terms. The access report will show you all users whose access started/ended during the specified dates and the access that they received. You can learn which term and offer the user converted on, information on the user's payment, and if you have Print Subscription Confirmation, it will provide all necessary information about the user such as name, address, and contact information. For a full list of the fields provided in the access report, click here. If a user has access to more than one term, each of the accessible terms is listed separately in the given report. You can choose to obtain all access data in a given date range or you may specify fields that you would like to hone in on if you know what information you are looking for.
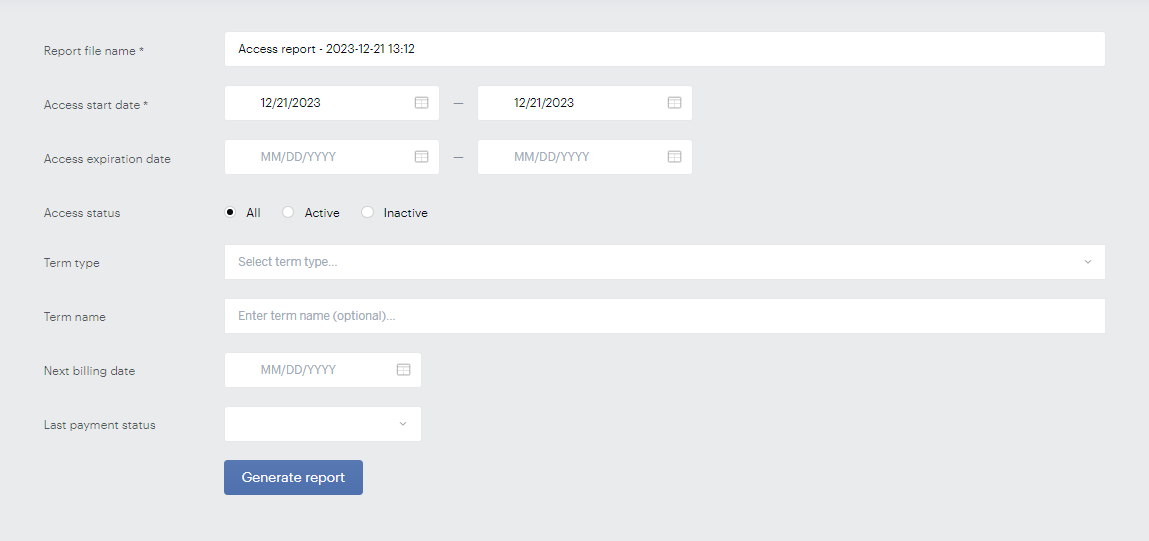
This report contains also users' access to registration terms and campaign codes the user saw prior to converting.
Access records of deleted users are excluded from the report.
How to generate access reports
Report file name: First give your file a descriptive name for your own identification purposes. This field is required.
Date range: Click on either presented date, which will bring up two calendar modals side by side. Choose a start and end date. You may choose both within the same modal or use both modals. Click "Apply selected dates" at the bottom of the modal when you are satisfied with the date range. This field is required. Note that if you choose a past date, it will show which users had active access on that date, which might not correspond with current access.
If you wish to specify more detail to get information on a narrower segment of your users, you may do so using the fields below.
Access status: You may specify whether you would like to obtain information on active or inactive access by clicking the appropriate radio button.
Term type: You may filter by term type by selecting the desired type from the dropdown menu.
Term name: You may also select specific terms that you would like information on by selecting the desired term from the dropdown menu.
Next billing date: You can view only those who have a specific upcoming billing date by selecting the Next billing date (again, you must click Apply selected date at the bottom of the calendar modal when you are done).
Last payment status: Finally, you can filter by the status of the last payment from the given options in the dropdown menu (completed, disputed, refunded, or verified).
Once you have specified the information you would like, click Generate report.
You may then view the generated report in the Download Center, which you can access by clicking the text that appears next to the Generate report button that says Go to Download center. Alternatively, you can click on Reports→[bolder]Download Center. You can then click Download on any previously generated file. If you do not see the .csv you just created, refresh the page in a few moments to allow sufficient time for generating the report.