
You can find information about emails you've sent (including term-specific emails) by going to Reports → Email Reporting. The email reporting pie chart shows the percentage of sent emails that were opened, bounced, and unopened by day, week, month, and quarter (these numbers include both those emails sent to consumers and to you as a publisher):
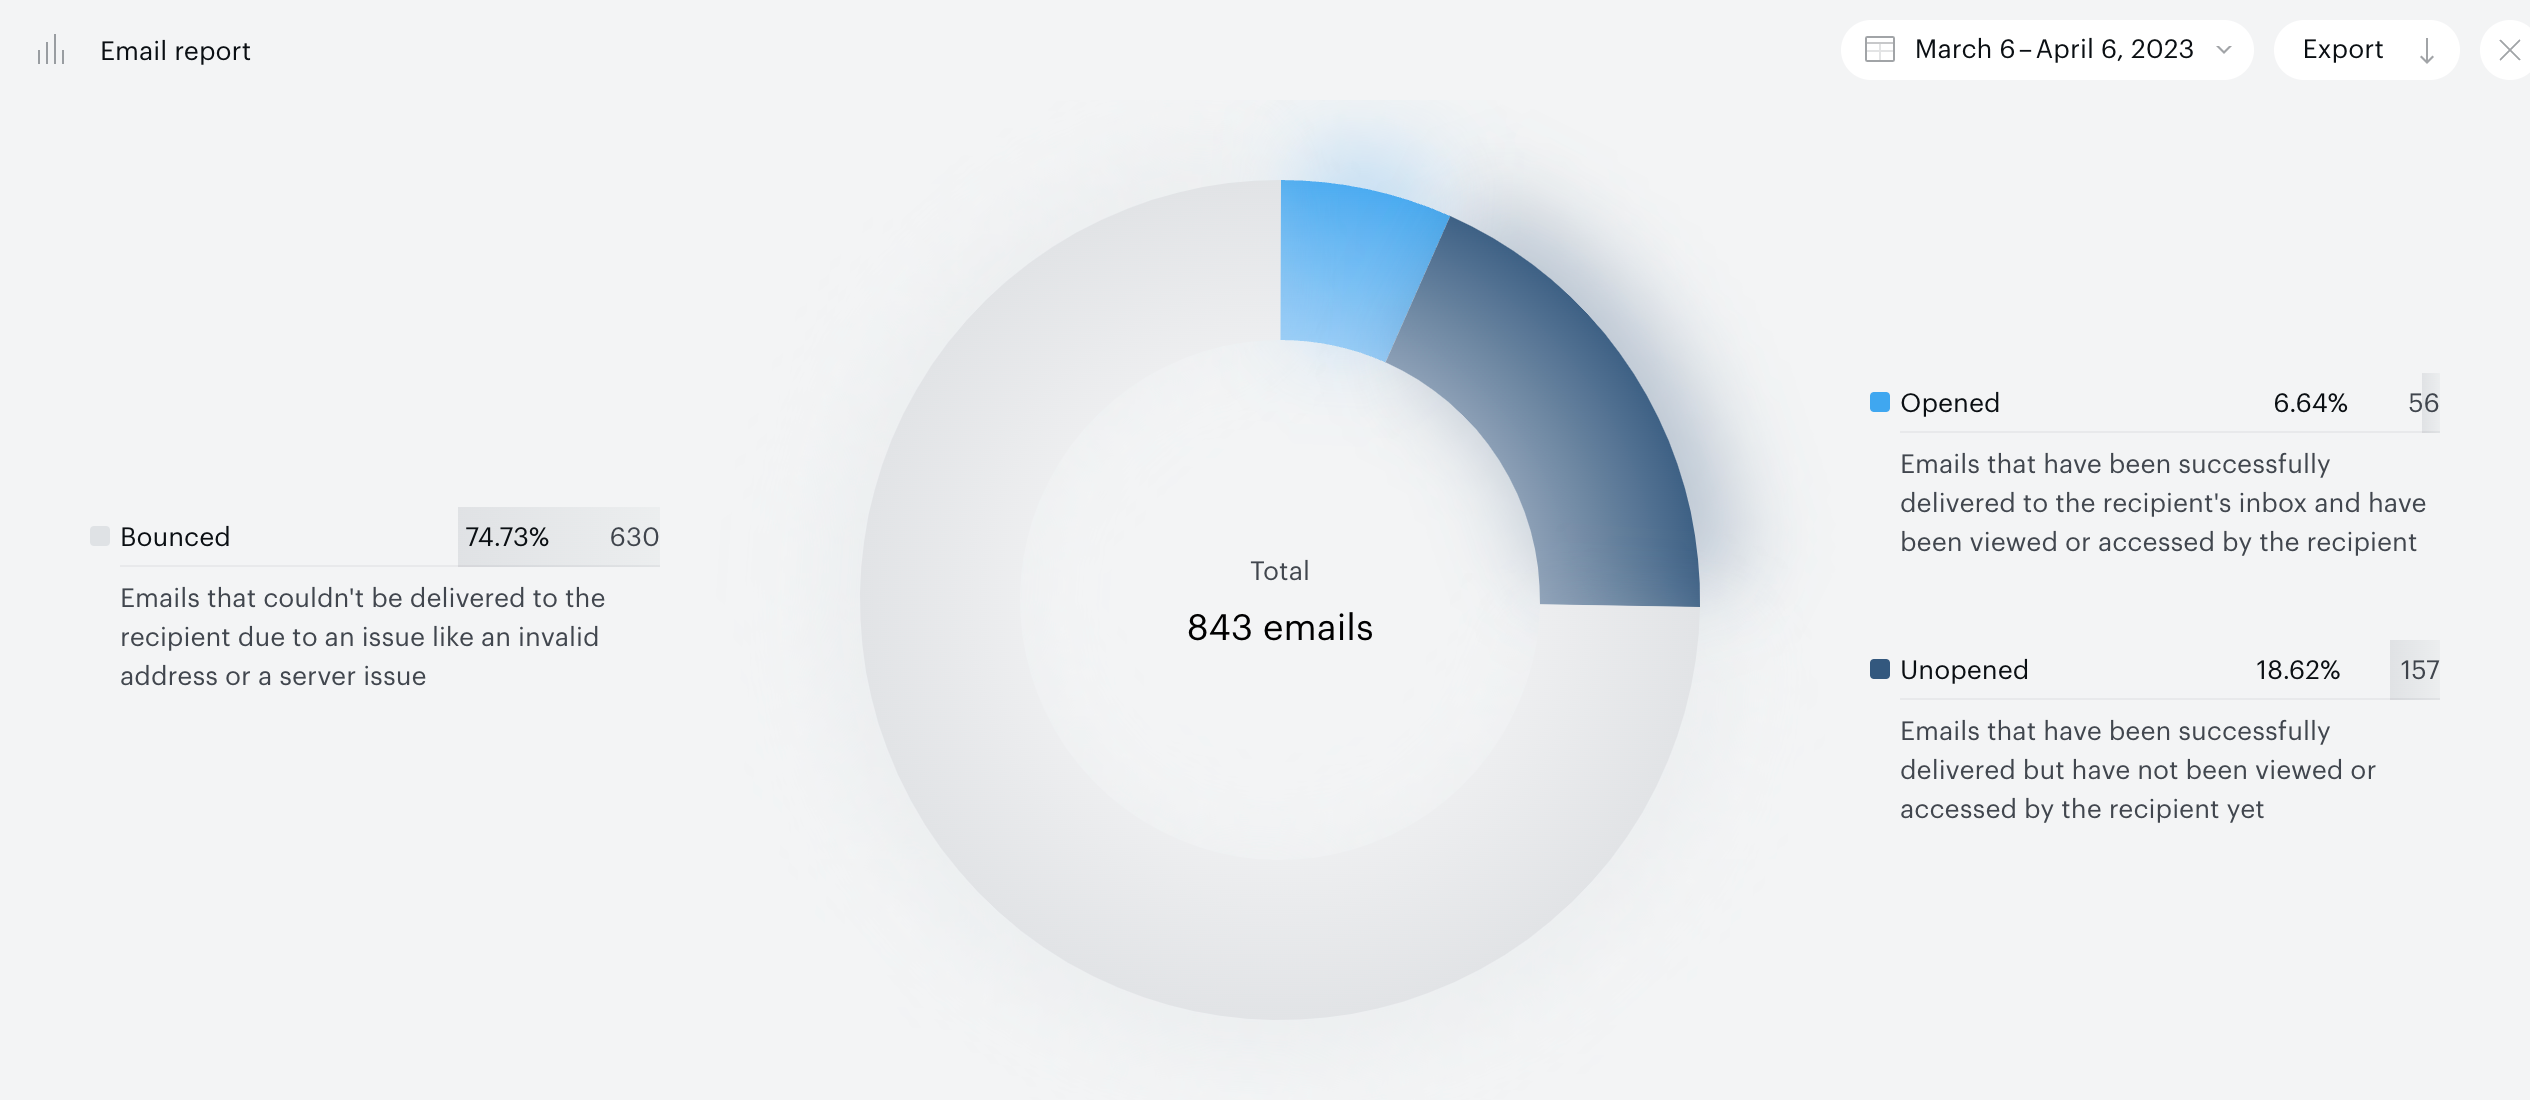
Below the graph, there are detailed email statistics including email type, number sent, number delivered, bounce rate, the number opened, and open rate. These numbers are calculated individually for each email template. Click-through rates are not being tracked so far.
If you want to resend a particular email to a user, you can do so from the user's account page.
Email Reporting: Negative Delivery Counts and Open Rates
In some cases, reports may show negative delivery counts and negative open rates for password reset emails. This is a result of how email events are recorded and filtered over time.
How Metrics Are Calculated
-
Delivered = Sent − Rejected
-
Open Rate = (Opened ÷ Delivered) × 100%
All metrics are calculated using distinct users per event type within the selected date range.
Why This Happens
Email events such as send and bounce (reject) are not always recorded at the same time. Since reporting is based on event timestamps (CREATE_DATE), related events for the same email may fall into different reporting periods.
This can lead to situations where:
-
A send event falls outside the selected range
-
A reject event falls inside the selected range
As a result, the report may show more rejects than sends, producing negative values.
Example Scenario: Narrow Date Range
-
Send event occurs before the report range
-
Reject event occurs within the range
Result:
|
Metric |
Value |
|---|---|
|
Sent |
0 |
|
Rejected |
1 |
|
Delivered |
-1 |
|
Open rate |
May appear negative |
Why Password Reset Emails Are More Affected
-
They are transactional (sent individually, not in bulk).
-
Bounce events can be delayed by hours or days.
-
Reports are often run on short or specific date ranges.
Key Takeaway
Negative values in delivery and open rate metrics are not data errors, but a side effect of time-based event filtering across reporting boundaries.