
Visualization
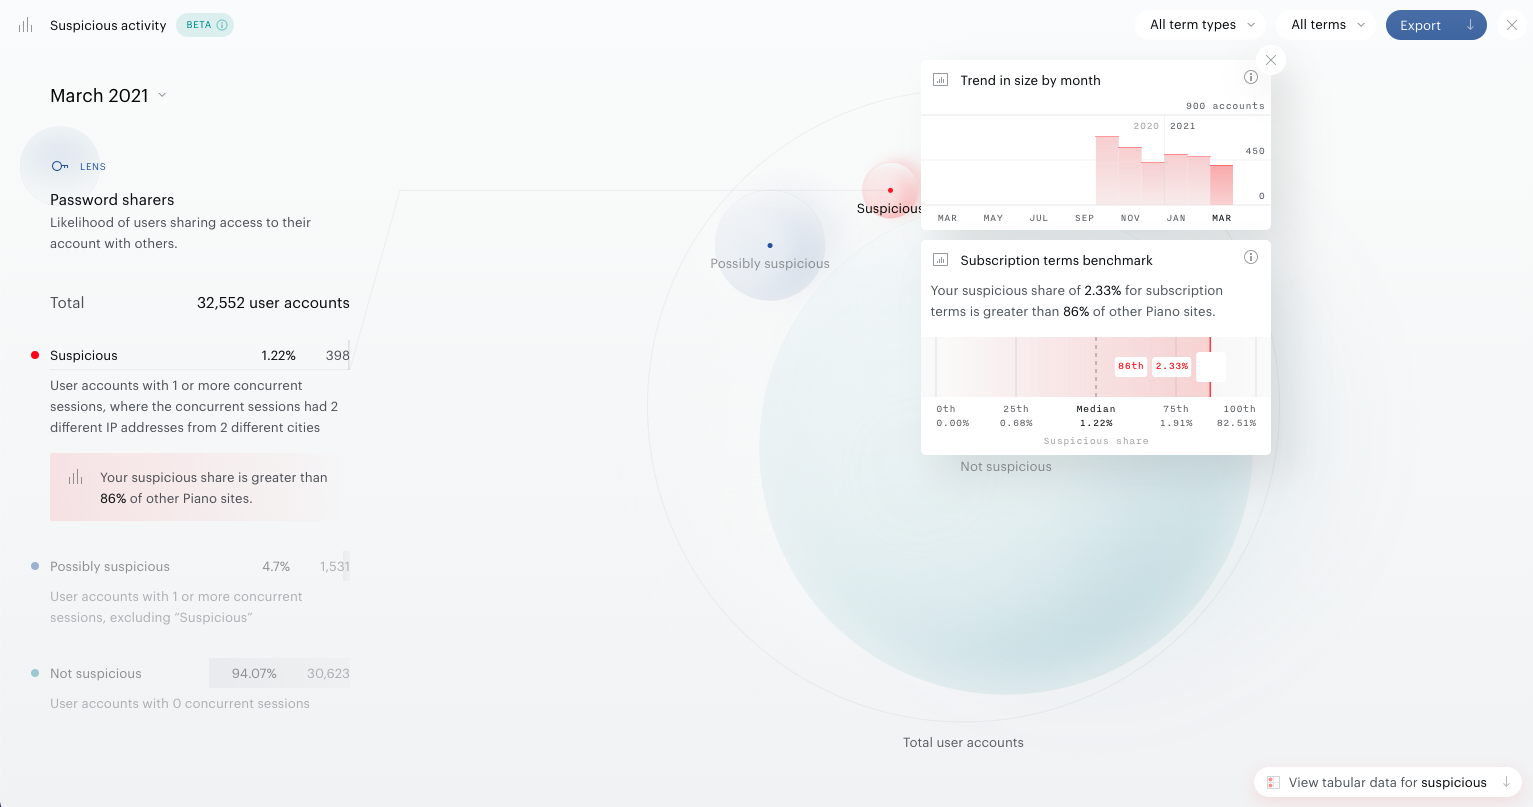
Accessed from the Visual Analytics section of the Reports tab in the navigation bar, the Suspicious Activity Report gives insight into password sharing behavior on your site.
This report shows how many of your users are suspected to be sharing their account credentials with others – colleagues, family members, or friends. We segment your user accounts into three categories of password sharing suspicion: Suspicious, Possibly suspicious, and Not suspicious. The categories’ correlation is visualized through a d3.js-based circle packing diagram, where the circle areas are proportional to the number of user accounts in each category.
The report is updated on the third day of each month; by default, it displays data for the last completed calendar month.
|
Suspicion category |
Technical definition |
Interpretation |
|
Suspicious |
UIDs that had two or more unique browser IDs which had concurrent sessions. Within those concurrent sessions, they were using different IP addresses in different cities. |
User accounts that we believe have a high likelihood of password sharing because they accessed content on more than one device and, at the same time, from different locations. |
|
Possibly suspicious |
UIDs that had two or more browser IDs which had concurrent sessions. |
User accounts that have some likelihood of password sharing their password because they accessed content on more than one device at the same time, but not necessarily from different locations. |
|
Not suspicious |
UIDs with no concurrent sessions. |
User accounts that didn’t access content from different locations at the same time at all. |
The report compiles data in the "unique" section by considering the entire interaction history of these users, encompassing more than just the monthly interactions, to present you with that specific number.
The rationale behind the cumulative nature of this report lies in instances where a user logs in from a different IP address, for instance, but fails to log out there. Consequently, the content remains accessible on that device without this action being recorded in the User's History tab. This logic extends to browser IDs and cities as well.
Filters
There are a few filters available on the visualization page.
-
Month
-
Term type
-
Term
At the top left of the report, you can change the month you’re viewing with the Month Year dropdown.
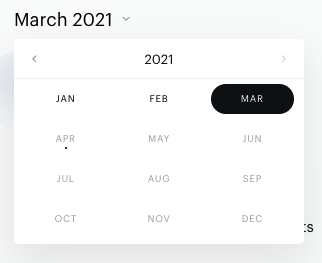

To filter for users with specific terms or term types, use the All term types and All terms dropdowns at the top of either view of the report; they are handily presorted by count of active user accounts. The filter will be applied in both views if configured in either the visualization or tabular data views.
In the tabular data view, you can also filter for specific suspicion categories with the All user segments dropdown.
Exploring
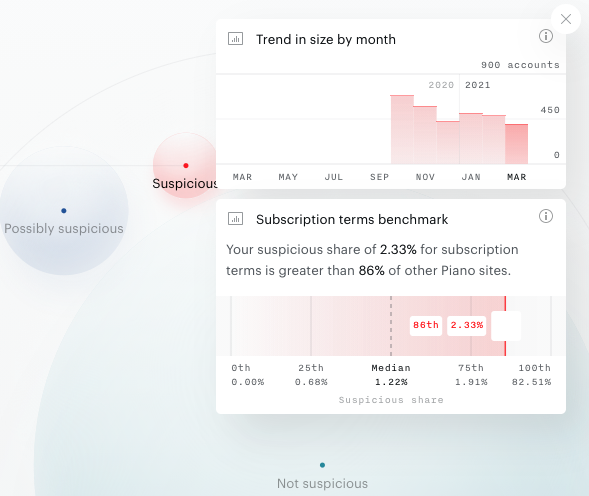
When viewing the report, you may think to yourself, “So 1.34% of my users are marked as suspicious... should I be concerned?” To answer this question, you can explore your diagram: click a suspicion category to see trend and benchmark data in popover charts.
Trend
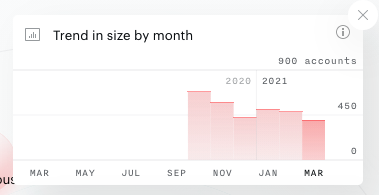
View the proportion of your term-possessing user account population that has been characterized into a suspicion category over the last 12 completed months. Do so by clicking any of the three suspicion category circles or definitions. The Term and Term type filters apply.
Benchmark
To understand if password sharing behavior on your site is unusually high or low as compared to other sites, Piano has benchmarked the share of suspicious user accounts across sites on the platform. This benchmark shows where your site ranks on the suspicious share relative to other Piano sites. To access the benchmark, click any suspicion category circle in the visualization.
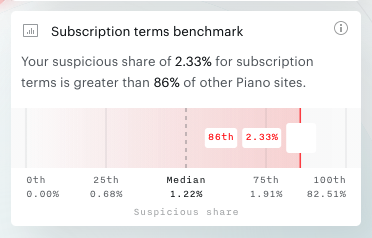
Suspicious share = suspicious user accounts with subscription term(s) / total user accounts with subscription term(s)
Example: Accounting for just subscription terms, if 134 of your 10,000 user accounts are flagged as suspicious, your suspicious share is 1.34%; this may have mapped to the 78th percentile (inclusive definition) in our benchmark distribution. That means that your site’s suspicious share of 1.34% is higher than or equal to 78% of sites included in the benchmark.
Piano sites included in this benchmark are only those that have at least 1000 user accounts with at least one pageview in the configured month via subscription terms. The benchmark is only available for the Suspicious category. The Term and Term type filters do not alter the benchmark.
Table
To view the report with more granularity, you can navigate to the tabular data below by clicking the bottom right View tabular data button.
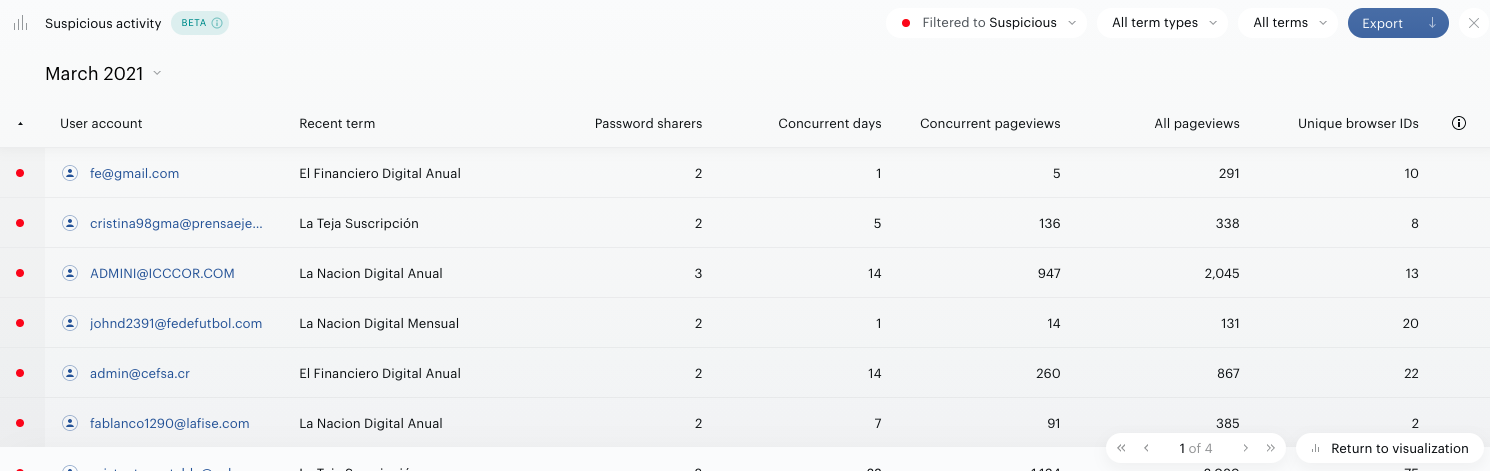
The table shows rows as the unique user accounts that had access during the selected month. You can view each user account’s suspicion category and additional activity metrics in the table’s columns.
|
Metric name |
Definition |
Included in UI |
Included in export |
|
Suspicion category |
Suspicious, Possibly Suspicious, and Not Suspicious |
✓ (as a colored dot)
|
✓ |
|
User ID |
The user ID (UID) associated with a user account. |
|
✓ |
|
User account email |
The email address associated with a user account. It can be clicked to view the account in user mining. |
✓ |
✓ |
|
Recent term |
For user accounts with multiple active terms, the name of the term with the most recent access start date. |
✓ |
✓ |
|
Term type |
The term type of the recent term. |
|
✓ |
|
Term ID |
The term ID of the recent term. |
|
✓ |
|
Term start date |
When the most recently created term began. |
|
✓ |
|
Password sharers |
The highest number of people accessing a user account at the same time, in different cities, with different IP addresses. It serves to approximate the number of people using the same user account. |
✓ |
✓ |
|
Concurrent days |
The count of days with concurrent sessions. |
✓ |
✓ |
|
Concurrent pageviews |
The count of pageviews consumed during concurrent sessions. |
✓ |
✓ |
|
All pageviews |
The count of all pageviews made by an account during the month. |
✓ |
✓ |
|
Unique browser IDs |
The count of unique browser IDs. Each browser that consumed content from this account has a unique ID, so this metric can be used as a proxy for the number of devices accessing this account. |
✓ |
✓ |
|
Unique IP addresses |
The count of unique IP addresses from which the account consumed content. |
|
✓ |
|
Unique cities |
The count of unique cities from which an account consumed content. |
|
✓ |
Taking action
With this information, we imagine you’ll want to do something about your password sharers. Here are some ideas.
1. Understand individual users
Use the link to user mining in the tabular data view to find more about users who misuse their subscriptions.
-
Navigate to the tabular data view.
-
Click a user’s email address and explore their profile.
2. Extract email addresses
Take the email addresses of suspicious users from the report export and contact them via email.
3. Reflect on your business model
Some business-to-consumer sites may see that a high percent of their users are sharing passwords. This would be a good opportunity to introduce shared subscriptions to some offers if they have not already done so. Or perhaps, for sites that already have offers utilizing shared subscriptions, it’s time to experiment with copy, prices, and templates paired with the offers. Piano Composer’s A/B test tool is a great place to perform such testing.
Other sites, often business-to-business sites, can use the Suspicious activity report to check in on clients they have negotiated to grant access for a capped number of seats with Site licensing. If a certain licensed customer of Piano's client has all seats used and some user accounts flagged as suspicious in this report, it may be time to speak with the customer and negotiate the contract to include more seats.
Glossary
Browser ID: Each browser has a unique ID, so this metric can be used as a proxy for the number of devices accessing this account.
Concurrent: At the same time. When two or more sessions overlap in time in at least one minute.
IP address: A unique address that identifies a device on the internet. It gives a sense of location.
Session: The period of time a user account was active on your site or app.
Filter by Term Type: Payment, Registration, External, Custom, Gift, Dynamic, Specific email addresses contract, Email domain contract, and Linked terms.
Suspicion categories: All user accounts are split into three categories with varying levels of password sharing suspicion.
-
Suspicious: User accounts that had two or more unique browser IDs which had concurrent sessions. Within those concurrent sessions, they were using different IP addresses in different cities.
-
Possibly Suspicious: User accounts that had two or more browser IDs which had concurrent sessions.
-
Not Suspicious: User accounts with no concurrent sessions.
Suspicious share: For users filtered for terms (Payment, Registration, External, Custom, Gift, Dynamic, Specific email addresses contract, Email domain contract, and Linked terms), the number of user accounts flagged as suspicious divided by total user accounts.
UID: The unique identifier that is given to each user account by whichever user provider platform your site uses.
User account: In the context of this report, the UID must have made at least one pageview via the conversion on a term within the month configured in the report.