
How to access
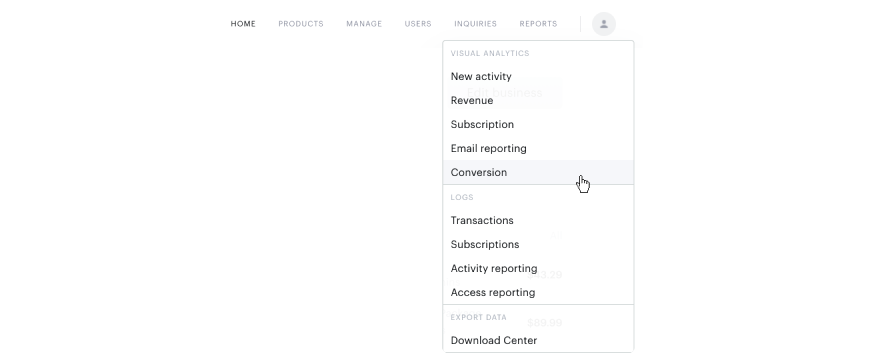
Access the Subscription Management + Billing conversion report by clicking the Reports dropdown within the navigation bar on any page:
Main chart
Once you have accessed the report, you will see the main chart, which displays Subscription Management + Billing conversions that occurred during checkout by term type over time by default, with the option to view total exposures instead.
Please be informed, that conversions which are logged manually (for example via the API endpoint /publisher/conversion/registration/create), will not be included in this report since we don’t have the corresponding exposures for these conversions. The same applies to external conversions.
Important: This report only includes first-time purchases in the conversion numbers. Upgrades and renewals are not considered in the conversion metrics displayed.
You can opt to filter conversions by term type, a specific term or offer, and as always you can choose a custom time period and interval that is best for viewing the data you are interested in.
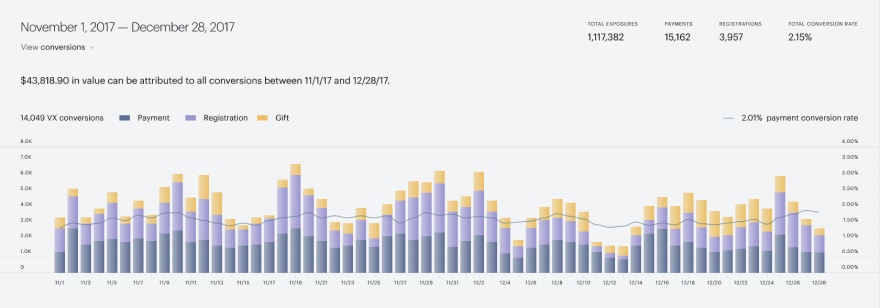
You can select whether you would like to view exposures or conversions via the dropdown in the upper left:

The chart always displays the conversion rate, regardless of which metric you have chosen to view in the chart. You can hover over any interval in the series to reveal the number of conversions, number of exposures, and the conversion rate for that interval, regardless of your metric selection.
Please note, that if a single offer - which includes Registration and Payment terms - is shown to a user, the counter for payment and registration Exposures will increase, but the total amount of Exposures will equal 1. The total number of Exposures is not the sum of Exposures in all categories, because there may be Exposures that belong to several categories at the same time.
An exposure is registered any time a user is presented with visible action. More details about exposures are available here.
By default, the report includes data for all offers and terms. You can choose to filter this report for a specific term or offer or by selecting a term type you would like to view data on. This allows you to view the specific performance of a term as well as the general performance of just ‘payment conversions’ or ‘registrations’. You can choose Select by term type…, Select by offer…, or Select by term... to select which term types, terms, or offers to include on the chart, tabular data, and exports.

Finally, you can customize the time period by clicking the date dropdown near the upper-righthand corner of the screen. Doing so will allow you to view data for any window you choose, with the data aggregated into days, weeks, month, or quarters.
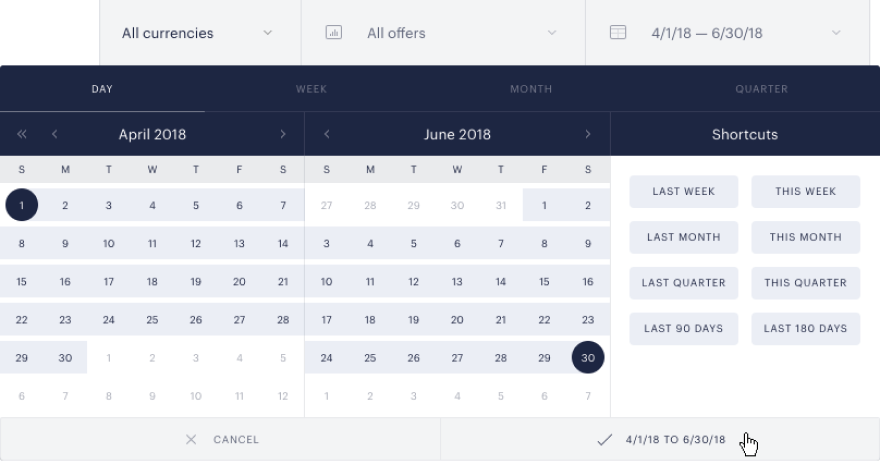
Click on the confirmation box in the lower right of the date selector to update the chart and table data.
The report's data is being refreshed on an hourly basis.
Note: You may only select a date range consisting of up to 180 distinct data points, i.e. 180 days, weeks, months, or quarters. If the selected date range contains too many data points, use a higher interval (e.g. aggregate by week instead of day) or shorten the time range.
Tabular data
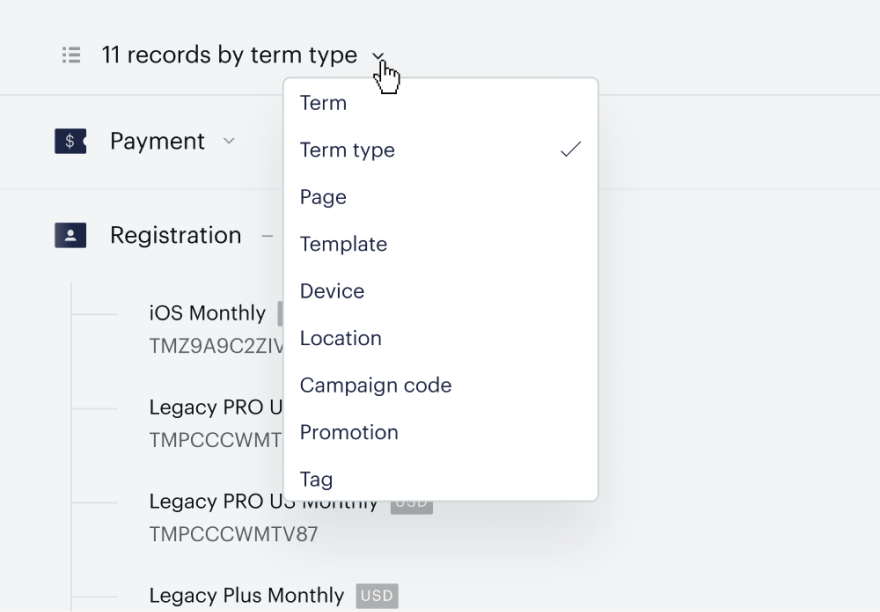
Beneath the main graphic, there is a table that displays the data driving the report. You can hover on the column headers to view the definitions for each metric. By default, this table presents data by term, but you can select to display conversions by other categories as well:
-
Term: Displays the exposures, conversions, and conversion rate for each Template-Offer-Term combination you have configured that has at least one conversion in the selected time range. This will include shared subscription terms. More details are available here.
-
Term type: Displays the exposures, conversions, and conversion rate for each term, grouped by term type.
-
Template: Displays the exposures, conversions, and conversion rate for each template that has generated at least one conversion.
-
Expanding a row will display master and variant totals for each template. Read more about templates and variants here.
-
Expanding a row will also display conversions by currency if applicable, with each currency listed on a separate row.
-
-
Page: Displays the exposures, conversions, and conversion rate for each URL that users converted on. You can click on a listed URL to copy it to your clipboard.
-
Device: Displays the exposures, conversions, and conversion rate for each device type that users converted on:
-
Expanding a row will display totals for every OS-Browser combination for that device type.
-
-
Location: Displays the exposures, conversions, and conversion rate for your highest-converting locations:
-
Top markets – Displays the top 15 states or provinces by total conversions from around the world.
-
Country – Displays the top 15 countries by total conversions.
-
-
Campaign code: Displays the attributed conversions and average time to conversion by campaign code. If a transaction was refunded, then the campaign code of the conversion will not be shown in this report. If several campaigns led the user to conversion, this conversion will be evenly distributed to the campaigns' stats. I.e. if there were 3 campaigns, each of them will receive 1/3 conversions. We calculate the time to conversion as the time between the moment when the user came to the site with the special link for the first time, and the conversion itself. We don’t apply any weights to this metric here. The attribution lookback window for campaign codes in the conversion report is 90 days.
-
Promotion: Displays the number of conversions with a promotion applied.
-
Tag: Displays the exposures, conversions, and conversion rate by page tags.
Only 15 data points are displayed for each item type within a category (e.g. only 15 OS-Browser combinations are displayed for each device). To obtain the full data, you can export the table as a CSV.
Note: Conversions that occurred when a user was subscribed by a Team Member directly via the Piano dashboard are not shown in the Subscription Management + Billing Conversion report, because we provide statistics here to calculate conversion rates and evaluate the effect of exposures.
Exporting data
You can export the raw data underlying the Subscription Management + Billing conversion report as a CSV at any time. The export will provide the data for the time range and offer you have filtered by and will provide the full data set driving the report.
To generate the export, click the icon at the top right of the screen:

This will reveal a dropdown that lets you select between downloading the current page (table-state) or a ZIP containing each possible table-state.
Note: Generating the entire report CSV export may take a few seconds depending on the size of the files. The download will begin automatically once the generation is complete